Align Shelf Share with Market Share for CPG Growth
-1_1747205908.webp)
For consumer packaged goods (CPG) brands, market share is everything—but Shelf Share is where the battle is truly fought. In today’s dynamic retail landscape, where many purchase decisions happen at the shelf, brands must ensure their physical presence aligns with performance. As competition intensifies and shelf real estate becomes scarce, optimizing Shelf Share in relation to market share has become a critical retail execution priority.
Forward-thinking CPG brands are now using advanced retail analytics, mobile sales tools, and point-of-sale (POS) data to ensure their Shelf Share accurately reflects their true market strength. This data-driven approach leads to smarter merchandising, efficient trade spend, and better overall performance in-store.
🛒What Is Shelf Share and Why It Matters?
Shelf Share refers to the amount of space a brand occupies within a product category on retail shelves. It can be measured in two ways:
-
Facings Count: The number of product fronts visible to consumers.
-
Linear Shelf Space: The physical shelf width a product takes up, measured in inches or centimeters.
While market share reflects actual consumer demand, Shelf Share reveals sales potential. A product underrepresented on the shelf—even if it’s in high demand—might be missing out on its full revenue opportunity. That’s why aligning these two metrics is essential to boost sales and streamline operations using tools like a sales workflow enhancement app or a sales route planning app.
📊Why Compare Shelf Share to Market Share?
Aligning Shelf Share with market share uncovers vital insights that help CPG brands fine-tune strategy and optimize retail presence:
1. Detecting Imbalances in Product Mix
A high-demand product with limited Shelf Share suggests untapped potential. Conversely, an underperforming product that monopolizes shelf space should trigger a reassessment. Tools such as a sales management app or a sales tracker app can help visualize these inconsistencies and guide better planogram decisions.
2. Strengthening Retailer Negotiations
Backed by performance data, brands can present a strong case to retail partners for gaining more shelf space. Demonstrating that a product outperforms despite lower visibility can lead to expanded presence and priority placement.
3. Prioritizing Inventory and Restocking
By integrating Shelf Share analysis with real-time sales data from systems like a sales order management app or inventory replenishment software, brands can quickly identify stockouts and refill shelves before competitors step in.
📈Using Retail Analytics to Uncover Growth Opportunities
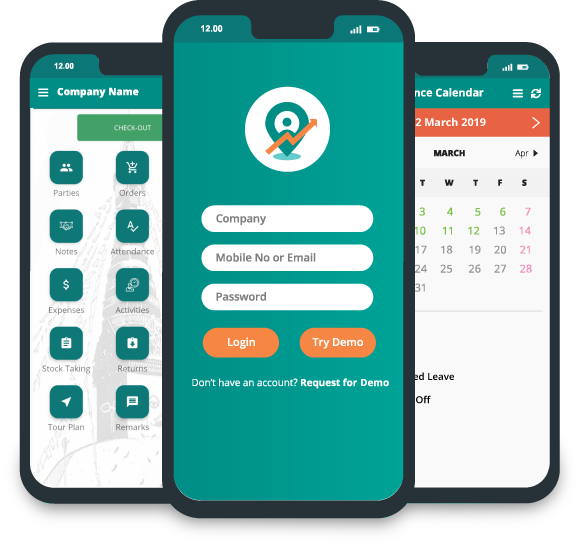
CPG brands equipped with analytics and field execution tools like a field sales application or sales force tracking app can actively monitor and optimize Shelf Share across stores. Key tactics include:
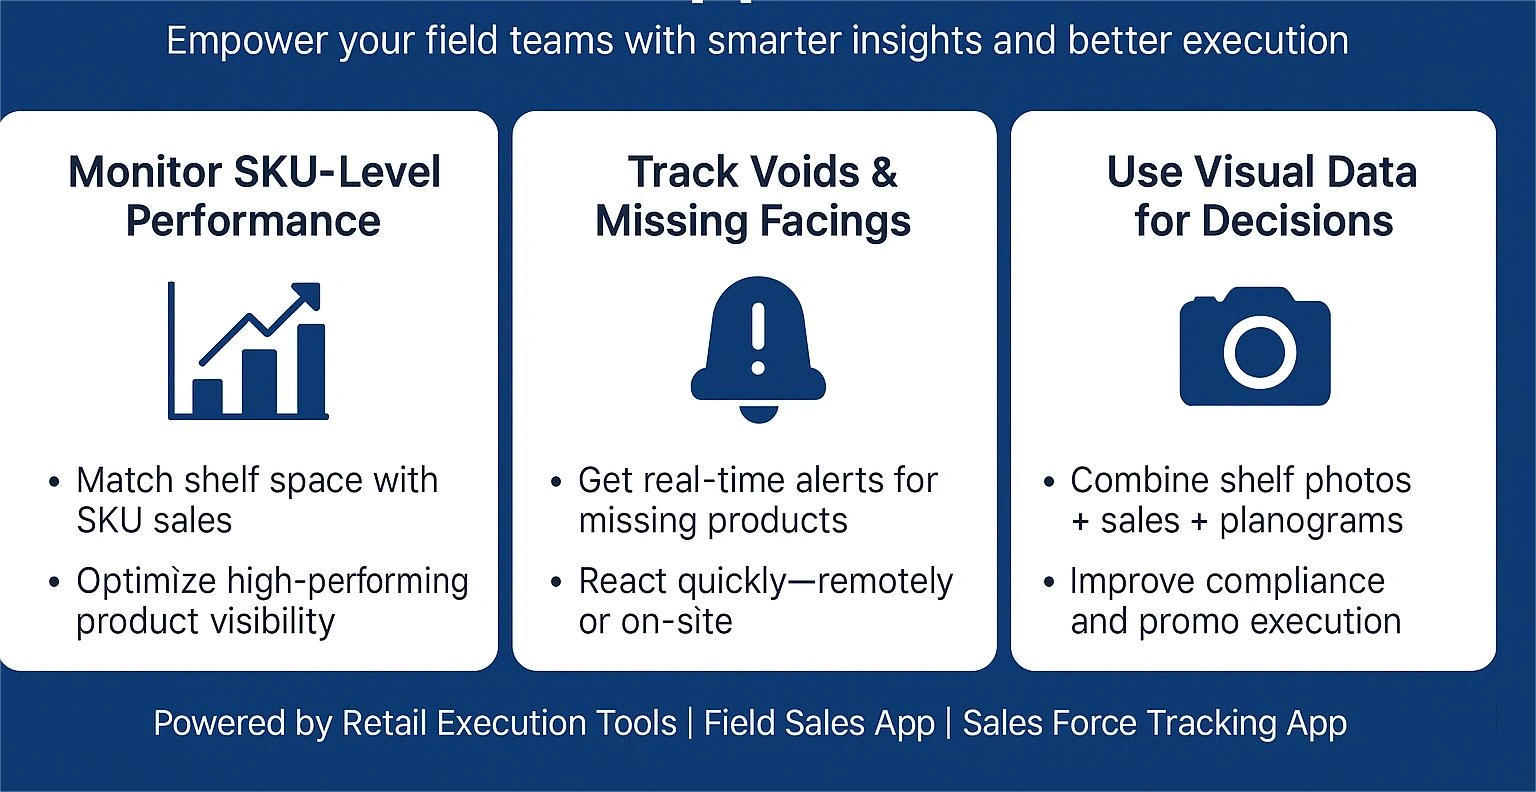
🔍 Monitoring SKU-Level Performance
Analyze how each SKU performs by correlating its shelf presence with sales data. This insight enables smarter shelf space allocation—prioritizing high-demand products to boost sales velocity and reduce stockouts.
🚫 Tracking Voids and Missing Facings
Leverage real-time visual data and automated alerts to quickly identify when high-performing SKUs are missing or underrepresented on shelves. This proactive approach minimizes lost sales and helps field teams respond promptly—without needing to be physically present.
📸 Using Visual Data for Smarter Decisions
Combine shelf images with sales reports and planogram compliance data to uncover execution gaps. This holistic view supports precise in-store actions, enhances promotional effectiveness, and ensures brand consistency across locations.
🎯Real-World Example: Reallocating for Maximum Return
Consider this scenario:
-
Product A: 10 cm of shelf space, 1,000 units/month.
-
Product B: 30 cm of shelf space, 300 units/month.
Here, Product A is clearly outperforming its allocated space. By reallocating shelf space from Product B to Product A—guided by insights from a retail execution app or sales route management tool—the brand can maximize sales per centimeter and increase ROI on store real estate.
💻Shelf Share Insights Without Physical Store Visits
Thanks to digital innovation, tracking Shelf Share no longer requires manual store visits. Here’s how modern brands are leveraging automation:
-
POS data integrated with a Distribution Management System helps monitor product performance continuously.
-
A sales operation software can match authorized SKUs per store with actual sales to detect out-of-stock issues.
-
Alerts from mobile dashboards notify field reps or managers when products vanish from shelves, enabling quick intervention.
This automated visibility empowers brands to protect their presence, ensure availability, and stay ahead of the competition.
🚀Final Thoughts: Data-Driven Shelf Share Drives Growth
Shelf Share and market share are intrinsically linked. When aligned, they unlock actionable insights for retail strategy, promotional planning, and product optimization. With the help of digital tools like a b2b sales automation software or territory management app, brands can:
-
Detect distribution voids before they impact sales.
-
Justify more in-store space through performance data.
-
Refine product mix and boost promotional ROI.
Shelf Share isn’t just a static metric—it’s a powerful growth lever. By integrating it with sales and inventory tools, CPG brands can enhance visibility, elevate performance, and dominate the shelf.
Ready to elevate your retail execution strategy? Start aligning your Shelf Share with market share to outpace the competition at every aisle.
✅ Frequently Asked Questions (FAQs)
Q1: What is the difference between Shelf Share and market share?
A: Shelf Share refers to the amount of physical space a brand occupies on a retail shelf, while market share measures a brand’s overall sales within a category. Shelf Share reflects in-store visibility, whereas market share reflects consumer demand. Aligning both helps optimize product strategy and sales execution.
Q2: Why is Shelf Share important for CPG brands?
A: Shelf Share is crucial because it directly impacts product visibility and availability at the point of purchase. If a high-performing product has limited shelf space, it may underdeliver on potential sales. Increasing Shelf Share based on market data ensures CPG brands capture maximum retail opportunity.
Q3: How can I measure Shelf Share effectively?
A: You can measure Shelf Share by counting product facings and calculating linear shelf space (in cm or inches). Tools like a field sales tracking app, sales management app, or retail execution app help automate this process and integrate it with sales data for deeper analysis.
Q4: Can I track Shelf Share without visiting stores physically?
A: Yes, many CPG brands now use POS data, shelf photo recognition, and mobile retail tools like a sales force tracking app or distribution management system to track Shelf Share remotely. These tools alert you to out-of-stocks or missing facings without the need for physical audits.
Q5: How does aligning Shelf Share with market share drive growth?
A: When Shelf Share accurately reflects market share, brands can ensure top-selling products are properly represented in-store. This alignment improves inventory efficiency, supports better retailer negotiations, and enhances ROI on shelf space—ultimately driving sales growth and brand visibility.
Explore more
👉SKU Rationalization: Optimize Product Portfolios For Growth
👉Supercharge your Field Sales with Data-Driven CPG Sales Strategies
🗣️ See What Users Say About Us!
Delta Sales App, trusted by businesses for streamlining sales processes and boosting productivity, is highly rated on top review platforms.
See what real users have to say about us:
⭐ Delta Sales App on FirmSuggest
-1785498898-resized320.png)

-1785213419-resized320.png)