CPG Data Analytics: a Complete Guide to Smarter Sales
_(17)_1745216626.png)
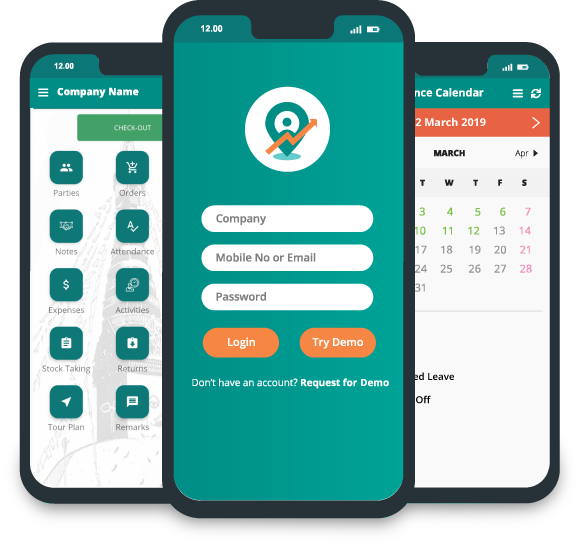
In the fast-paced and fiercely competitive world of Consumer Packaged Goods (CPG), brands can no longer rely on gut feeling or outdated reports to make decisions. With thousands of products vying for shelf space and attention, brands that harness real-time data are the ones gaining a strategic edge. That’s where CPG data analytics comes into play. Whether you're using a modern Field Sales App to monitor your in-store performance or leveraging DMS software to streamline your distribution channels, data is the thread that connects every point of retail execution.
This guide dives deep into how CPG brands can use analytics to optimize operations, boost retail performance, and ultimately drive growth.
What is CPG Data Analytics?
CPG data analytics refers to the practice of collecting, measuring, and interpreting data from the field to improve retail execution, supply chain efficiency, and overall brand performance. It includes everything from rep activity in stores to POS data, stock levels, promotional compliance, and consumer behavior.
But the goal isn’t just to collect more information — it’s about turning that data into action. Whether it's solving for out-of-stocks, improving display compliance, or planning smarter routes for your sales reps, CPG analytics provides the insight needed to make impactful, data-driven decisions.
Why CPG Brands Need Data Analytics Today?
As the market becomes increasingly crowded, brands are being asked to do more with fewer resources. Sales reps are covering larger territories. Retailers demand better in-store support. And consumers expect availability, pricing, and presentation to be flawless — every time.
Here’s how data helps:
-
Increases rep productivity by identifying high-priority stores
-
Improves sell-through by optimizing in-store promotions
-
Reduces stock outs by detecting inventory risks in real time
-
Strengthens retailer relationships with data-backed performance proof
-
Boosts trade marketing ROI through smarter planning
With CPG analytics, your team spends less time reacting and more time executing strategies that move the needle.
_1745218342.png)
The Three Core Types of CPG Data
To build an effective analytics strategy, you need to understand the three primary types of data that CPG companies must track and combine:
1. Observational Data
This is the data collected by your field reps while they're in the store. It includes:
-
Stock availability and out-of-stocks
-
Shelf positioning and facings
-
Price checks and competitor promotions
-
Display setup and promotional compliance
Collected through tools like a Field Sales App, observational data provides a snapshot of what’s actually happening at the retail level. It’s essential for identifying execution gaps and opportunities in real-time.
2. Activity Data
This type of data captures what your field reps are doing — how often they’re visiting accounts, what actions they’re taking, and how efficiently they’re working.
Key activity metrics include:
-
Visit frequency and coverage
-
Time spent per store
-
Tasks completed per visit
-
Route optimization and travel time
Activity data gives brands the visibility needed to improve field productivity and reduce operational waste.
3. Sales Data
The ultimate outcome — how much product is being sold — provides context for the other two types of data. You can track:
-
POS sales volume by store/SKU
-
Sell-through rates by region
-
Impact of promotions on sales
-
SKU-wise velocity
Sales data is often pulled from retailer systems, distributor dashboards, or integrated via DMS software. When tied back to rep activity and store observations, it reveals which efforts are truly driving revenue.
How CPG Data Powers the Cycle of Continuous Improvement?
The most effective way to apply analytics is by incorporating it into a cycle of continuous improvement — a feedback loop that turns data into insight, then action, then even more refined data.
Step 1: Insight
Use your analytics tools to identify trends, gaps, or missed opportunities. For instance, you might discover that stores with fewer visits have more out-of-stocks — or that a display in a specific region isn’t driving expected sales.
Step 2: Planning
Based on those insights, adjust your field strategy. Assign more visits to underperforming stores, revise promotional tactics, or reallocate inventory based on velocity.
Step 3: Execution
Deploy your reps with clear priorities and objectives. As they take action, they feed new data back into the system — refreshing your understanding and restarting the cycle.
This process ensures your field strategy evolves with the market and consistently improves over time.
_1745217137.png)
Solving Real-World Challenges with CPG Analytics
Here’s how analytics can directly solve the problems that many CPG teams face:
-
Catch Out-of-Stocks Before They Happen
With real-time shelf condition tracking and sales trend monitoring, you can detect when product levels are falling dangerously low and take action before you lose sales.
-
Boost Display Compliance
Use observational data to identify stores where displays are not set up properly or at all. Non-compliant displays can lead to a 20–40% drop in promo ROI. Your field team can be dispatched to correct them quickly.
- Prioritize High-Value Accounts
Analytics can reveal which stores drive the most revenue or show the biggest upside. Rather than spreading rep visits evenly, you can focus more time and resources on these high-opportunity locations.
- Improve Trade Promotion Effectiveness
See exactly how your campaigns perform by region, store type, or time period. Combine observational and sales data to assess which promotions are worth repeating — and which should be retired.
- Align Supply and Demand
Integrating analytics with your DMS software allows you to align distributor orders with actual store demand. This avoids costly overstocks or missed replenishments.
Building Your Analytics Stack: What Tools You Need
To fully capitalize on your data, your tools need to work together. Here's a quick overview of systems that support CPG analytics:
Combining these systems gives you a 360° view of your business — from retail shelves to regional sales to channel performance.
Track These KPIs to Improve Field Performance
When you're building out your analytics strategy, here are the most impactful KPIs to start with:
-
Product availability %
-
Sales per rep visit
-
Visit frequency per store
-
Compliance rate on promotions
-
Time to restock out-of-stock items
-
Order fulfillment rate by distributor
-
Sales lift during promotion periods
Track these KPIs over time and compare them across regions, teams, or retailers to find patterns and opportunities.
Scaling Your Analytics Strategy
Once your analytics foundation is set, here’s how to scale it effectively:
-
Start with a pilot program across a few territories
-
Train reps to collect quality data consistently
-
Automate dashboards for daily visibility
-
Use monthly reviews to optimize strategy
-
Expand to include more data sources like consumer insights or market share
With the right systems and processes in place, even small teams can act like large, data-driven organizations — and compete at the top.
Final Thoughts
CPG data analytics is more than a trend — it’s the new foundation for brand success. When used strategically, it allows your teams to see clearer, act faster, and perform better. By combining store-level insight, rep activity, and sales data, brands create a powerful feedback loop that fuels continuous improvement.
Whether you're just beginning your analytics journey or scaling across regions with the help of DMS tools and field apps, the key is consistency, action, and evolution.
In an industry where shelf space is tight and margins are thinner than ever, the brands that harness data will lead — and the ones that don’t may fall behind.
FAQs
❓ What is the biggest benefit of CPG data analytics?
Answer: It gives you actionable insight into retail execution, allowing you to improve store performance, optimize rep activities, and increase overall sales.
❓ How do I start using analytics if I have limited tools?
Answer: Start simple — use a Field Sales App to capture store data, and track a few key KPIs like visits, stockouts, and display compliance. Expand from there.
❓ How does analytics help with distribution?
Answer: Integrated with DMS software, analytics ensures your distribution is demand-driven, reducing missed sales due to poor inventory planning.
❓ What’s the ROI of using analytics in CPG?
Answer: Brands that apply analytics effectively often see 10–25% improvements in field productivity, faster issue resolution, and better promotional performance.
❓ How often should I review my data?
Answer: For best results, review performance weekly at the team level and monthly at the regional or strategic level. Real-time dashboards make this much easier.


