
How Can FMCG Brands Measure the Effectiveness of In-Store Promotions?

An in-store promotion can look successful on the surface. A retailer agrees to a display, a discount gets communicated to the sales team, promotional stock ships out, and the field force reports the activation happened. None of that actually proves the promotion worked.
The harder question is what happened after execution. Did the promoted SKU sell above its normal baseline? Did the promotion actually run in every planned outlet? Was the product even available when shoppers showed up? Did the retailer follow the agreed display or pricing terms? Did the incremental sales justify what got spent? And did some outlets simply outperform because they already had stronger underlying demand, nothing to do with the promotion at all?
For FMCG brands, answering any of that takes more than a post-promotion sales report. Promotion effectiveness comes down to connecting sales uplift, outlet execution, stock availability, shelf visibility, secondary sales, and promotional spending, all at the right level of detail.
This blog explains how FMCG brands can measure the effectiveness of in store promotions, which metrics matter most, how to build a reliable measurement process, and how field force automation can provide the outlet-level data required to improve future promotion decisions.
Why Measuring In-Store Promotion Effectiveness Is So Difficult
The biggest challenge is rarely the calculation itself. Most FMCG teams can work out sales growth or compare promotional-period sales against the previous period without much trouble.
The real difficulty is getting reliable, comparable data in the first place. A single promotion might involve the brand team, a distributor, reps, retailers, merchandisers, promoters, and finance, and each one records a different slice of the activity. If those records stay disconnected, managers end up staring at a final sales number with no idea what actually caused it.
-
Fragmented Data Across Distributors, Retailers, and Field Teams
Promotion data usually sits scattered across several systems and spreadsheets. Distributors hold primary and secondary sales data. The rep submits outlet visit information through a DSR. Merchandising tracks display compliance somewhere else. Finance tracks promotional spending in a different sheet entirely. That's the familiar problem: plenty of data, no single reliable view of what actually happened. Say a brand promotes a new beverage SKU across 1,000 outlets. Sales go up during the promotion period, but only 650 of those outlets actually had promotional stock available the whole time. Without outlet-level execution data, the brand might assume the promotion worked across all 1,000 outlets when the real story is very different, and that gap leads straight to an inaccurate read on the whole campaign.
-
Manual Audits Are Slow, Inconsistent, and Expensive
Manual promotion audits usually rely on field visits, paper forms, spreadsheets, photographs, or messages coming in from reps. That works fine for a small pilot but falls apart fast once a promotion spans hundreds or thousands of outlets across multiple territories. Different reps record things differently. Some report right away; others update days later. Photos don't always get clearly linked to the right outlet, SKU, or promotion. By the time all of that gets consolidated, the promotion's often already over. What managers end up with is a retrospective report, not something they could actually act on while it mattered.
-
Lack of Real-Time Visibility Into Execution vs. Plan
A promotion always starts with a plan: specific outlets, SKUs, dates, displays, pricing, stock quantities, and activities. The field team delivers the actual execution reality. The gap between those two is where most promotion problems live.
A territory might be scheduled for 300 promotional outlets, and only 220 get the activation on time. Some outlets run into stockouts. Others get poor shelf placement. Some reps skip planned outlets entirely because the route didn't allow for it. If managers only ever see the final sales figure, they can't tell a weak promotion apart from weak execution, and that distinction matters a lot, because the fix for one is completely different from the fix for the other.
Key Metrics FMCG Brands Should Track for Promotion Effectiveness
A reliable promotion measurement framework needs to combine commercial outcomes with execution metrics. Look only at sales, and real problems stay hidden. Look only at compliance, and an activity can look successful on paper while generating barely any incremental demand. Here are the key metrics worth tracking.
Sales Uplift: Incremental vs. Baseline Sales
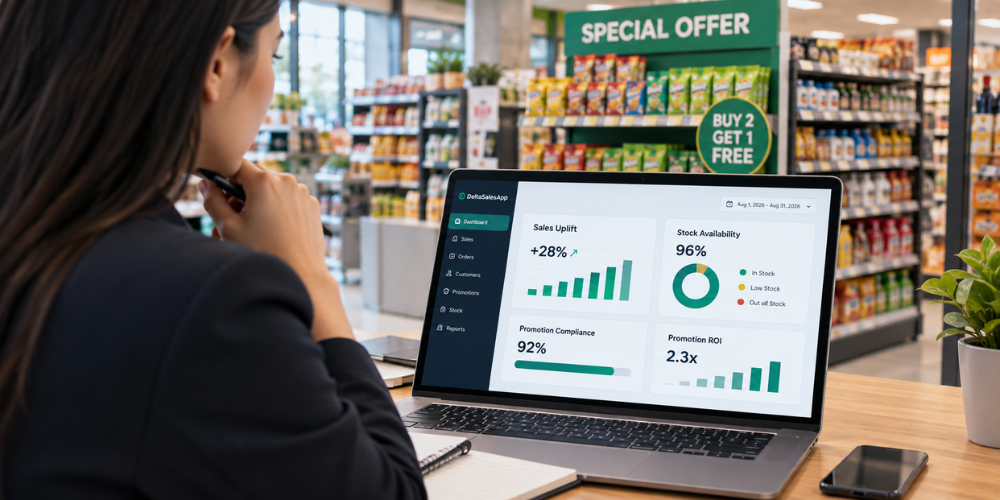
Sales uplift measures whether a promoted SKU generated more sales than it normally would have. The basic concept is
Sales Uplift = Promotional Period Sales − Baseline Sales
The difficult part is establishing a meaningful baseline. A simple comparison with the immediately previous week may be misleading if that week had unusual demand, a distributor stock-out, a holiday, or another promotion. Brands should consider normal sales patterns for the same SKU and comparable outlets when establishing the baseline. For example, if a SKU normally sells 10 units per outlet per week and sells 15 units during a promotion, the apparent uplift is 5 units. But the analysis should go further. Was the increase concentrated in high-volume outlets? Did low-volume outlets respond? Did sales decline immediately after the promotion? Did another SKU lose volume at the same time? These questions help determine whether the promotion created genuine incremental sales or simply shifted existing demand.
Promotion Compliance and Execution Score
For a promotion to truly succeed, it must be executed effectively. A promotion compliance score helps us understand if each outlet has fulfilled the agreed-upon criteria, which include:
-
Installation of promotional displays
-
Displaying the correct SKU
-
Applying the right price or offer
-
Having the necessary promotional materials
-
Maintaining minimum shelf space
-
Completing planned activations
-
Ensuring promotional stock is available
The scoring model will vary depending on the specific campaign. A straightforward execution score could measure how many requirements were completed against the total number of requirements. This distinction is crucial, as it separates promotion effectiveness from execution quality. If sales are underwhelming and compliance is low, the issue likely lies in execution. Conversely, if compliance is high but sales are still lacking, it may be time to rethink the promotion itself.
Share of Shelf and Planogram Adherence
For numerous FMCG categories, how visible a product is can significantly impact its sales potential. During promotional events, it's essential for brands to keep an eye on whether their products are positioned and spaced as planned on the shelves. Field teams can take photos of the shelves during their visits to stores and use these images to check:
-
Where the product is placed
-
Its position on the shelf
-
The size of the display
-
The presence of the correct SKUs
-
Availability of promotional materials
-
Any encroachment by competitors
-
Adherence to the planogram
The aim here goes beyond just snapping pictures. The insights gathered should empower managers to understand if a lackluster promotional performance is tied to ineffective retail execution.
Stock Availability During the Promotion Window
Ensuring stock availability is crucial for successful promotions. If a promoted product isn't on the shelves, it simply can't drive additional sales. This means we need to link promotional efforts with the actual stock levels at distributors and stores. During their visits, field representatives can check stock levels, spot any shortages, and communicate what needs to be restocked. Brands should look at the following metric:
The number of promotional outlets with stock available divided by the total number of promotional outlets.
Low stock availability can shed light on why sales might be underwhelming, even if the promotion itself is appealing. It also helps determine if the problem is related to generating demand or managing supply effectively.
Cost per Incremental Unit and ROI on Trade Spend
In the end, FMCG brands must assess if the extra sales made it worth the investment. To determine the cost per incremental unit, use the formula:
Cost per Incremental Unit = Total Promotion Cost ÷ Incremental Units Sold
Next, evaluate the promotion ROI to see how the financial gains from these additional sales stack up against the total promotional spending. It's important to include all relevant expenses in this calculation, such as
-
Discounts
-
Retailer incentives
-
Display costs
-
Costs for sampling or promoters
-
Promotional materials
-
Extra merchandising expenses
-
Distribution-related costs
A promotion that generates significant volume may still be commercially weak if the cost of generating that volume is too high.
How to Measure Promotion Effectiveness Step by Step
Measuring in-store promotions effectively requires a repeatable process. The following six-step framework gives FMCG teams a practical starting point.
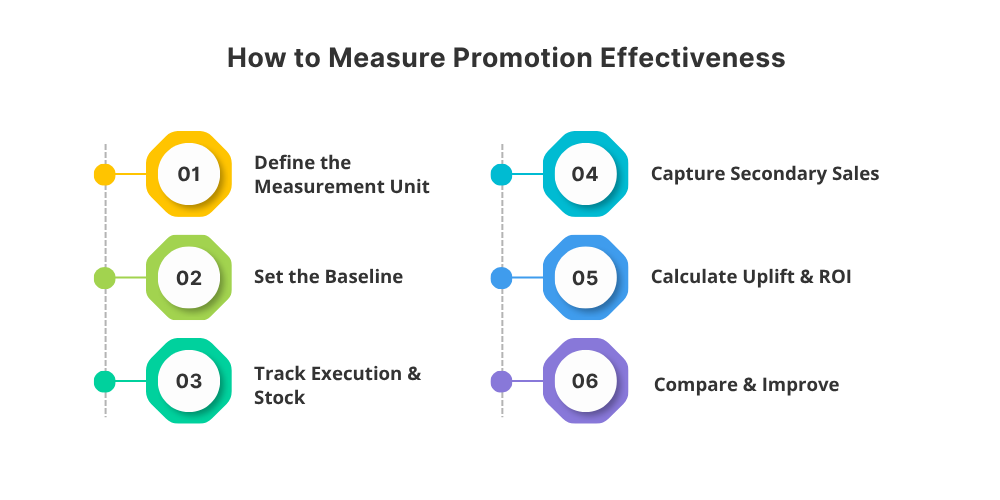
Step 1: Define the Measurement Unit: Territory, Outlet Type, and SKU
Before the promotion starts, define exactly what you want to measure. Do not treat the entire market as one number. Break the promotion down by relevant dimensions such as:
-
Territory
-
Distributor
-
Outlet type
-
Outlet category
-
SKU
-
Sales representative
-
Promotion type
-
Promotion period
For instance, a beverage promotion might thrive in supermarkets but struggle in traditional retail settings. If you lump all outlets together, these distinct performance patterns can get lost. The same goes for different territories; a promotion could see a significant boost in one city while yielding modest results in another due to factors like distribution reach, retailer involvement, or local consumer preferences.
Step 2: Set the Baseline Before Launch
A baseline gives you something meaningful to actually compare against. Record normal sales for the selected SKU and outlet group before the promotion starts, and account for normal weekly fluctuations and any unusual events that could throw off the comparison. It's also worth checking whether the outlets had enough stock before the campaign began. That matters because an artificially low pre-promotion sales figure can make the promotion look far more successful than it really was.
Step 3: Track Execution and Stock at the Outlet Level in Real Time
As the campaign kicks off, it's essential to keep an eye on the real happenings at the outlet. The visit from the field representative can serve as a crucial moment to gather various promotion metrics. For instance, the representative can take note of:
-
Which outlet was visited
-
Availability of promotional SKUs
-
Quantity of stock on hand
-
Compliance with display standards
-
Placement on the shelves
-
Presence of promotional materials
-
Any issues with execution
-
Photos or evidence of execution
-
Feedback from the retailer
Strong in-store promotions also depend on consistent execution across displays, pricing, stock, and store teams. These in-store promotion tactics can help brands improve execution before measuring the final results.
Step 4: Capture Secondary Sales During the Promotion Window
Primary sales from company to distributor don't always reflect real consumer demand. A distributor might buy extra stock ahead of a promotion, and that inventory can just sit there unsold. That's why secondary sales matter so much for measuring a promotion properly. Track movement from distributor to retailer during the campaign and compare it against the established baseline. If distributor stock climbs while retailer movement stays weak, that's a reason to hold off calling the promotion a success. A promotion needs to drive genuine market movement, not just load inventory into the channel and call it a win.

Step 5: Calculate Uplift, ROI, and Cannibalization
After the campaign wraps up, gather the commercial and execution data. Next, calculate:
Incremental Sales = Actual Promotional Sales − Expected Baseline Sales
Evaluate the financial results by considering the relevant promotional costs. It's also important to ask: Did the promoted SKU gain sales at the cost of another SKU? This phenomenon is known as cannibalization. For instance, offering a discount on a premium pack might boost its sales while simultaneously decreasing sales of the standard pack. Consequently, total category sales may rise much less than the growth of the promoted SKU indicates. A more thorough promotion analysis should consider:
-
Uplift of the promoted SKU
-
Overall category uplift
-
Movement of other SKUs
-
Performance at the outlet level
-
Costs associated with the promotion
-
Compliance with execution standards
-
Availability of stock
This approach gives a clearer view of the true incremental value.
Step 6: Compare Across Territories to Guide the Next Budget Cycle
The last step involves transforming the insights gained into actionable future strategies. Reflect on the promotion outcomes by examining:
-
Different regions
-
Various distributor networks
-
Specific outlet categories
-
Individual SKUs
-
Sales teams' performance
-
Types of promotions used
Say one territory delivers a 20% uplift with strong compliance and another only manages 5% despite similar promotional spending. That gap is worth investigating. It could come down to better route coverage, stronger distributor availability, higher outlet participation, cleaner execution, or just genuinely different market demand. Comparisons like that are what let a brand allocate future trade promotion budgets based on real evidence instead of a guess.
Why Manual Tracking Breaks Down at Scale
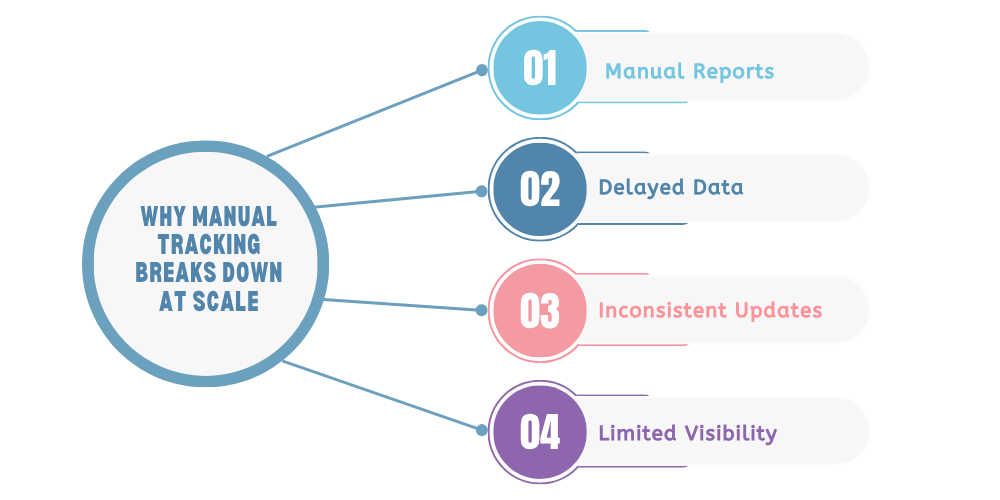
The traditional process of collecting promotion data manually creates several operational problems as the field network expands.
-
Field Reps Reporting on Paper or WhatsApp
Reps work under tight schedules. When promotion reporting relies on paper forms, phone calls, WhatsApp messages, or an end-of-day update, important details get lost or arrive late. A rep might remember a display went up but forget to note the exact SKU. Another might report a stockout without any indication of how long the outlet actually sat empty. Data like that is genuinely hard to standardize into anything useful.
-
Delayed, Inconsistent Outlet-Level Data
Promotion decisions need outlet-level visibility, but manual reporting usually only produces data after the activity's already happened. By that point, managers might not have found out which outlets got missed or which territories had execution problems until the promotion's nearly wrapped up. Delayed reporting makes corrective action almost impossible, too. If a high-volume outlet runs out of the promoted SKU on day three, finding out on day seven doesn't help anyone.
-
No Way to Compare Planned vs. Actual Execution
A promotion plan might call for 500 outlets, two visits per outlet, a specific SKU display, and a minimum stock level. Manual reporting makes comparing every planned activity against what actually happened genuinely difficult. A field force automation system connects the plan to complete visits directly, so exceptions stand out immediately instead of getting buried in a spreadsheet somewhere.
How Field Force Automation Gives You the Data This Measurement Needs
A field force automation system does not determine whether a promotion is commercially attractive. What it does is provide the operational data needed to make that judgment more accurately. For FMCG organizations managing large field teams, this is particularly useful because promotion execution happens where the sales activity actually takes place: at the outlet.
-
Real-Time Outlet Visit and Stock Data via Beat Plans
A structured beat plan assigns reps to specific outlets and territories. During the promotion, managers can actually see whether planned outlets are getting covered and whether reps are logging the execution information that matters. Location-based visit tracking also separates real, verified outlet visits from unverified reporting. And when stock availability gets captured during those visits, managers can spot exactly which outlets have promotional demand held back by a supply problem.
-
Order and Secondary Sales Capture at the Point of Visit
Capturing orders directly during outlet visits ties field execution to actual sales activity. Reps record retailer orders and relevant SKU quantities right there in the outlet, which lets teams compare promotional execution against real market movement instead of relying only on distributor-level numbers. It also makes it much easier to spot the outlets where the promotion ran perfectly but still didn't generate the expected orders, a distinction pure sales data would never show.
-
In-Store Promoter Reporting for Promotion-Specific Activations
For teams using in-store promoters, the in-store promoter management app provides better visibility into promotional activities at the outlet level. It can help track promoter attendance, assigned store tasks, SKU availability, photo proof, and display execution, making it easier for managers to verify whether planned promotional activities are being carried out as expected.
-
One Data Source Instead of Reconciling Distributor, Field, and Finance Sheets
One of the biggest advantages of centralized field data is reduced reconciliation. Instead of asking managers to compare multiple spreadsheets, messages, and reports, relevant information can be brought into one operational view. For example:
Outlet Visit → Stock Availability → Order → Secondary Sales → Promotion Execution → Territory Performance
This does not eliminate the need for financial or distributor data. Instead, it provides a stronger field-level foundation for combining those sources.
How Delta Sales App Helps FMCG Teams Track Promotion ROI in Real Time
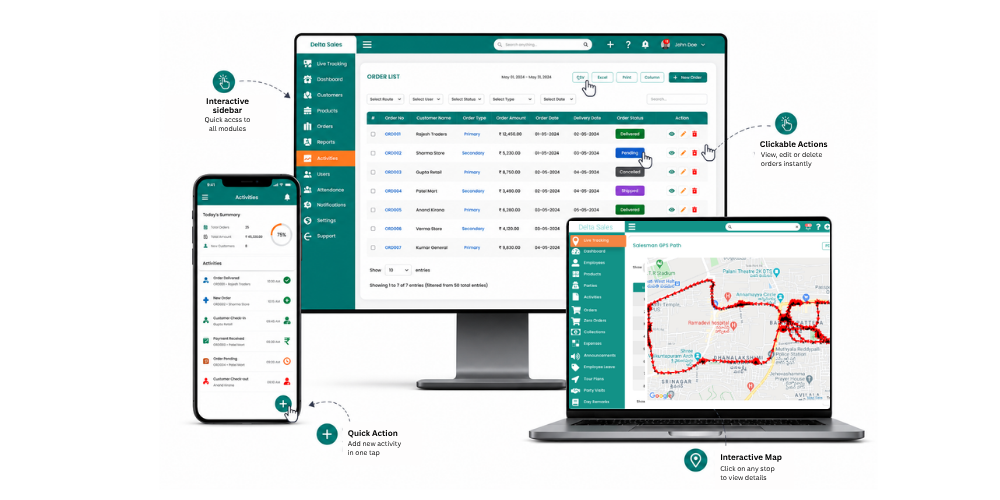
Delta Sales App supports the operational side of promotion measurement by connecting field activity, outlet coverage, sales capture, and execution data in one system.
For FMCG teams, the value isn't another dashboard. The real question is whether the data needed to actually evaluate a promotion gets captured consistently at the point where execution happens, not stitched together after the fact.
With Delta, teams use structured beat plans to organize outlet coverage and track field visits. GPS-based employee location tracking gives visibility into field activity, and outlet-level information shows managers exactly where promotional execution is happening and where the coverage gaps still are.
Reps can capture orders directly during outlet visits, which ties field execution to sales movement much more clearly. Stock and SKU information captured in the field also helps identify availability issues that could be quietly dragging on promotion performance.
For campaigns running dedicated in-store promoters, promoter management workflows handle attendance, store tasks, and photo-based proof of execution, giving managers real context when checking whether a promotional activity actually happened the way it was planned.
The bigger benefit comes from combining all of this together. Instead of judging a promotion by one final sales figure, FMCG teams can actually examine the relationship between:
-
Planned outlet coverage
-
Actual field visits
-
Stock availability
-
SKU movement
-
Orders
-
Promotion execution
-
Territory performance
-
Field team activity
That's what makes it possible to separate a bad promotion from poor execution. If a promoted SKU had strong stock availability, high compliance, and good outlet coverage but still delivered limited incremental sales, the offer or targeting probably needs a rethink. But if the promotion performed well wherever execution was complete and fell flat only in outlets with low compliance, the problem is operational, not strategic. That distinction is worth its weight when planning the next promotion budget.
Conclusion
Measuring the effectiveness of an in-store promotion isn't just comparing sales before and after a campaign. FMCG brands need to understand why sales changed, whether the change actually came from the promotion, stronger execution, better availability, seasonal demand, or just a shift between SKUs that had nothing to do with the offer.
The strongest approach combines commercial metrics, sales uplift, incremental units, secondary sales, promotion ROI, and cannibalization with execution metrics: outlet coverage, stock availability, shelf visibility, and promotion compliance.
Field force automation makes this measurement genuinely practical by bringing outlet visits, beat plans, orders, stock information, employee activity, and promotion execution into one structured workflow. For FMCG teams, that means promotion reviews can move past the simple question of "Did sales go up?" The better question is, where did the promotion work, why did it work, and what should change before the next rupee gets spent on trade promotion? That's the level of visibility it actually takes to make promotional budgets accountable and retail execution consistent.
If your field team is still piecing together outlet execution and sales activity from disconnected reports, book a free demo of Delta Sales App and see how a centralized field sales workflow can support better promotion measurement.