
How Poor Field Stock Visibility Distorts Inventory Turnover and Stock Cover Numbers

A business can hold a warehouse full of products and still be out of stock at the retail level. This may sound like a contradiction, but it is often the case when companies use inadequate or out-of-date field stock data. Primary sales may look good, distributors may seem well stocked, and inventory reports may look healthy. But when sales reps arrive at the market, they may find empty shelves, slow-moving goods, out-of-date stock, or inventory sitting unsold at the distributor level. The problem is the visibility of field stock.
If businesses can’t accurately see how much inventory they have, where it is, and how quickly it is actually moving through the distribution network, critical inventory metrics, like inventory turnover and stock cover, can become misleading.
These metrics are frequently used to inform demand forecasting, replenishment, purchasing, and working capital decisions. If the field data that backs up those figures is wrong, the decisions based on them can be wrong, too.
In this blog, we will look at how visibility of field stock affects inventory accuracy and how gaps in field data can distort key metrics like inventory turnover and stock cover. We’ll also discuss where visibility tends to break down, the business risks of relying on bad inventory numbers, and how real-time field data and Sales Force Automation and Distribution Management System tools can help businesses make better inventory decisions.
What Is Field Stock Visibility (And Why It Matters for Inventory Accuracy)
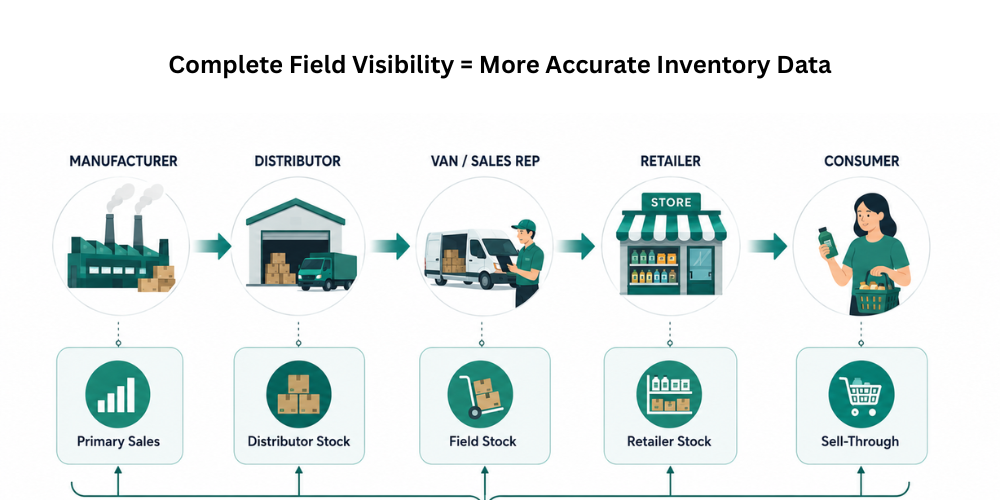
Field stock visibility is the ability to have accurate and timely information on inventory across the sales and distribution network, including distributors, retailers, warehouses, and field sales teams.
Traditional inventory systems typically have good visibility of warehouse stock. But once products leave the warehouse, the picture can become less clear. For example, products for FMCG companies can move from:
Manufacturer → Distributor → Retailer → Consumer
Sales representatives and van sales teams often manage their own inventory. If a company only monitors the initial transfer from manufacturer to distributor, it may be aware of how much stock has entered the channel but not how much has actually reached retailers and consumers. This difference is crucial because primary sales figures do not always reflect true market demand. Having precise field inventory data enables businesses to grasp:
-
Inventory held by vans and field teams
-
Identification of fast-moving and slow-moving SKUs
-
Requirements for reordering
-
Actual sell-through rates of products
How Field Stock Data Differs from Warehouse/ERP Stock Data
The warehouse and ERP systems usually track the inventory movements within the controlled supply chain of the organization. They may indicate goods received, dispatched, transferred, or stored. But field stock data offers a different perspective. It shows what happens once products are in the distribution and retail network. For instance, an ERP might state that a distributor received 1,000 units of a product. But that doesn’t mean the distributor has 1,000 units sitting around to sell today. The distributor could have:
-
Sold 400 units to retailers
-
Returned 50 units
-
Lost or damaged 20 units
-
Transferred 100 units
-
430 units remaining in stock
If those movements don't get captured right away, the numbers in the ERP can end up looking nothing like what's actually sitting in the field. That's why ERP inventory data and field sales data need to work alongside each other rather than being treated as the same source of truth.
Understanding Inventory Turnover and Stock Cover: The Basics
Before getting into how poor field visibility messes with inventory metrics, it helps to know what those metrics actually measure. Inventory turnover measures how efficiently stock is being sold and replaced over a given period. Stock cover, or days of supply, estimates how long current inventory can support expected sales at the current rate of demand. Both are useful, but they're answering different questions.
How Inventory Turnover Ratio Is Calculated
The basic inventory turnover formula is
Inventory Turnover Ratio = Cost of Goods Sold ÷ Average Inventory
For example, if a company has a cost of goods sold of $1 million and an average inventory of $250,000:
$1,000,000 ÷ $250,000 = 4
Say a company's inventory turnover ratio comes out to 4, meaning average inventory theoretically got sold and replaced four times over the period. But that number is only as good as the data behind it. If inventory sitting with distributors gets counted as actively moving stock, or returns and expiries aren't recorded properly, that turnover ratio ends up telling management a story that isn't actually true.
How Stock Cover (Days of Supply) Is Calculated
Stock cover estimates how many days the current inventory can support future sales. A simplified formula is
Stock Cover = Current Inventory ÷ Average Daily Sales
For example, if a company has 5,000 units available and sells an average of 250 units per day:
5,000 ÷ 250 = 20 days
Say the business has about 20 days of stock cover. The catch is both halves of that calculation depend on accurate field data. Overstate current inventory, and stock cover looks better than it actually is. Understate sales velocity, and the same thing happens.
Why These Two Metrics Are Meant to Work Together
Turnover and stock cover give you complementary views on inventory performance. Turnover tells you how often stock is moving. Stock cover tells you how long what's on hand will actually last. A company can have decent turnover overall while specific locations are running poor stock cover, and the reverse holds too: healthy stock cover on paper while individual SKUs are quietly running out. Looking at both together, alongside secondary sales, stock availability, sell-through, SKU movement, and inventory aging, gives a much clearer picture than any single number on its own.
How Poor Field Visibility Distorts Inventory Turnover
Poor field stock visibility can make inventory turnover appear healthier or weaker than it actually is. The biggest issue is that turnover calculations may reflect what was shipped rather than what was actually sold.
-
Inflated Turnover from Primary Sales Masking Slow Sell-Through
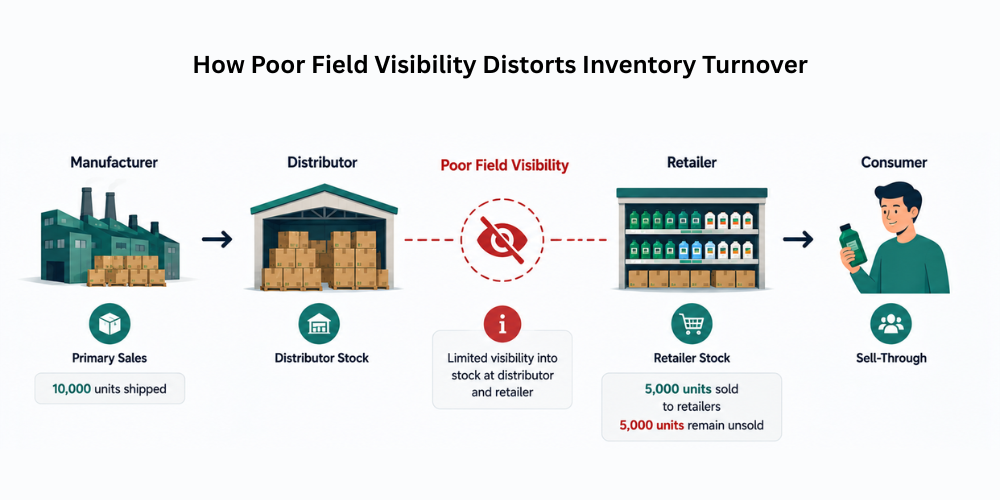
Suppose a manufacturer sells 10,000 units to distributors. The primary sales report shows strong movement. But what happens if distributors sell only 5,000 units to retailers while the remaining 5,000 units sit in distributor warehouses? From the manufacturer's perspective, inventory appears to be moving quickly. From the market's perspective, half of that inventory may still be sitting idle. This is where primary sales vs. secondary sales becomes important. Primary sales indicate movement from the company to the channel. Secondary sales provide visibility into movement from distributors to retailers. Without secondary sales tracking, strong primary sales can mask slow sell-through, leading to an inflated perception of inventory turnover.
-
Underreported Returns and Expiries Skewing the Ratio
Returns, damages, and expired product all skew inventory performance too. Say a product got sold to distributors and later came back damaged or expired. If that return isn't logged right away, the historical sales data keeps suggesting the product's moving fine when it isn't. The same problem shows up with expiry-related stock adjustments. Accurate reconciliation, return tracking, and stock ageing data are what actually reveal true inventory performance instead of a number that's quietly gone stale.
-
Delayed or Manual Stock Updates Creating Lag in Real Numbers
Manual inventory reporting adds another layer of uncertainty on top of everything else. A distributor might submit a stock report once every few days, sometimes weekly. By the time it reaches management, the actual inventory position has usually already moved: products sold, returned, transferred, or restocked in the meantime. That gap between what's actually happening and what's on the report is a real problem. Run turnover calculations on stale numbers, and management ends up making decisions based on inventory conditions that don't even exist anymore.
How Poor Field Visibility Distorts Stock Cover Numbers
Stock cover is only as accurate as the inventory and sales data used to calculate it. When businesses lack visibility into distributor, retailer, or van stock, reported inventory can differ from what is actually available in the market. These gaps can make stock cover appear higher or lower than it really is, affecting replenishment and inventory planning decisions.
Overstated Stock Cover from Hoarded or Unsold Distributor Inventory
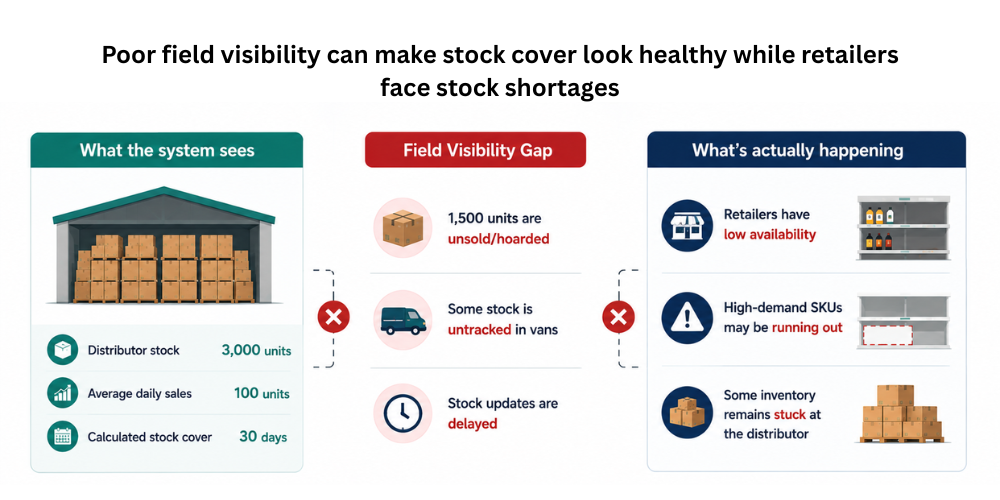
Say a distributor reports 3,000 units of a product, and the business calculates stock cover off that whole number. But 1,500 of those units have been sitting there for months because demand's weak. Technically, the inventory exists. Operationally, it's dead weight, not real market coverage. That's what overstates stock cover: management sees a healthy number and decides no replenishment is needed, while retailers keep struggling with poor availability the whole time.
Understated Stock Cover from Untracked Van/Field Stock
Sometimes, a different challenge arises. Sales representatives or van sales teams might have a substantial amount of products on hand that aren’t captured in the central inventory records. When this stock isn’t included in the available inventory count, the business risks underestimating its true inventory levels. This can lead to a misleadingly low stock cover and might trigger unnecessary restocking efforts. Implementing real-time management for van sales and tracking field inventory can bridge this gap effectively.
Impact of SKU-Level Blind Spots on Stock Cover Accuracy
Overall inventory figures can hide problems at the SKU level. A company might report 30 days of total stock cover across a territory. But this average could hide:
-
60 days of slow-moving products
-
5 days of high-demand products
-
Stockouts of important SKUs
-
Excess inventory of low-demand SKUs
That’s why businesses need visibility into inventory at the SKU level, not just the aggregate inventory numbers. By tracking stock by product, distributor, retailer, territory, and sales channel, you get a more accurate picture of actual availability.

Business Consequences of Distorted Inventory Metrics
When inventory turnover and stock cover numbers do not reflect actual field conditions, the impact goes beyond inaccurate reports. Distorted inventory metrics can influence forecasting, replenishment, cash flow, and product availability, creating problems across the entire supply chain.
Poor Demand Forecasting and Replenishment Decisions
Effective demand forecasting relies significantly on past sales trends and up-to-date inventory information. When field stock data is lacking, forecasting models might mistakenly view distributor shipments as true market demand. This misinterpretation can lead to:
-
Inflated demand estimates for slow-moving items
-
Deflated demand estimates for fast-selling SKUs
-
Erroneous replenishment amounts
-
Inefficient production strategies
-
Unneeded inventory relocations
To achieve precise sales forecasting and inventory management, it's essential to have visibility that extends beyond just the warehouse.
Cash Flow and Working Capital Risks
Inventory is a crucial part of working capital. When there’s too much unsold stock in the pipeline, cash gets stuck in products that aren’t bringing in returns fast enough. Meanwhile, businesses might keep buying or making more inventory because their systems suggest everything is moving well in the market. This leads to a frustrating cycle:
Lack of visibility → misleading metrics → bad replenishment choices → surplus inventory → cash flow issues
Improving inventory visibility empowers companies to make smarter purchasing and replenishment choices.
Stockouts and Overstocking Happening Simultaneously
One of the most challenging aspects of lacking visibility in the field is the simultaneous occurrence of stockouts and overstocking. Imagine a distributor in one area sitting on a mountain of excess inventory, while another area struggles with empty shelves. Without a clear view of inventory levels across territories, managers may miss these discrepancies until it's too late. This leads to a distribution network that operates inefficiently, with products sitting in the wrong locations instead of being where customers truly need them.
How to Fix Field Visibility Gaps for Accurate Inventory Metrics
Improving inventory accuracy starts with closing the gaps between field activity and reported data. Businesses need timely, reliable information from distributors, retailers, and sales teams to understand actual stock movement. The following approaches can help improve field visibility and make inventory metrics more accurate and actionable.
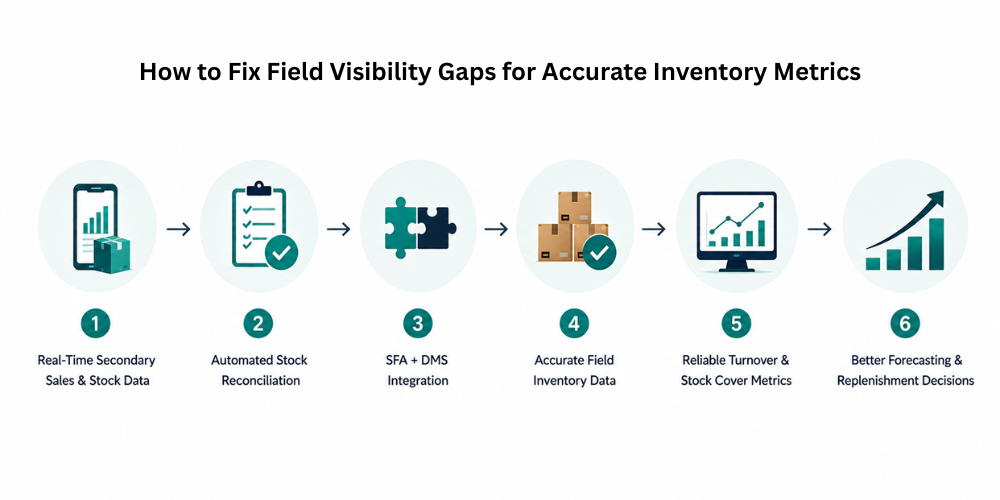
Real-Time Secondary Sales and Stock Data Capture
Sales representatives have the opportunity to gather retailer orders, sales figures, stock availability, and other essential field insights right during their market visits. This approach provides a fresher perspective on the dynamics occurring outside the warehouse. By utilizing a field sales automation software solution, businesses can effectively track:
-
Sales by retailer
-
Secondary sales
-
Current inventory levels
-
Orders placed
-
Returns processed
-
Product availability status
-
Instances of stockouts
-
Movement of SKUs
-
Details of visits made
With this timely field data at their fingertips, managers can easily compare what has been dispatched with what is actually selling in the market.
Automating Stock Reconciliation Across Distributors and Vans
Stock reconciliation gets hard when the data's coming in manually from multiple distributors, reps, and vehicles all at once. Automation keeps a consistent record of inventory movement instead. When a rep records an order or a sale, the system updates the relevant transaction and gives managers real visibility into field activity as it happens. Inventory management software, distributor management systems, and van sales solutions working together are what actually close the manual reporting gaps and get stock accuracy back on track.
Using SFA/DMS Tools to Sync Field Data with Inventory Systems
Sales Force Automation Software and Distributor Management System (DMS) tools play a crucial role in bridging the gap between sales activities and inventory insights.
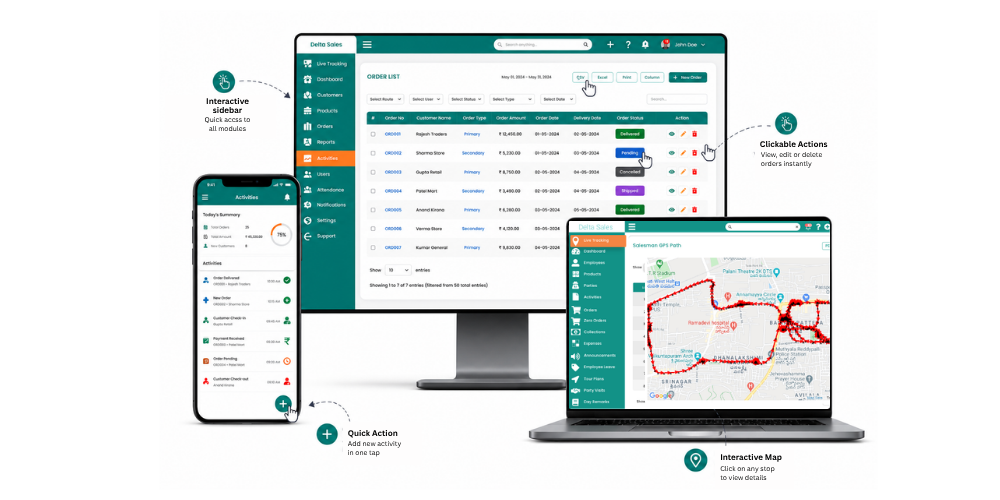
For companies with extensive field teams, a solution like Delta Sales App can streamline the process by integrating sales visits, order placements, retailer information, secondary sales, inventory tracking, and field reporting into a unified platform. Rather than treating warehouse reports as isolated from field operations, managers can leverage real-time field data to gain a comprehensive understanding of activities across distributors, retailers, territories, and SKUs. This holistic view lays the groundwork for:
-
Analyzing inventory turnover
-
Monitoring stock cover
-
Forecasting demand
-
Planning replenishments
-
Enhancing retailer stock visibility
-
Managing distributor inventory
-
Optimizing sales territories
-
Improving working capital efficiency
The aim goes beyond merely gathering more data; it’s about ensuring that the information accurately reflects the dynamics of the market.
Conclusion
Inventory turnover and stock cover are only as good as the data feeding them. Without real visibility into what's happening at the distributor, retailer, or van sales level, primary sales get mistaken for actual demand, unsold distributor inventory inflates stock cover, untracked field stock understates what's actually available, and delayed updates leave reports describing yesterday's market instead of today's.
The fix is better field stock visibility, built from real-time secondary sales tracking, inventory monitoring, stock reconciliation, SKU-level visibility, and SFA/DMS technology working together to give a genuinely accurate picture of inventory across the distribution network.
With Delta Sales App, field teams capture sales and inventory data right at the point where market activity actually happens. That's what makes inventory turnover calculations, stock cover analysis, replenishment decisions, and demand planning actually reliable.
Book a free demo today and see how Delta Sales App can help you make more accurate inventory and replenishment decisions.
FAQs
1. What is field stock visibility in inventory management?
Field stock visibility means knowing what's actually sitting on shelves and in vans right now, not what a report from three days ago said. It covers every point in the chain: distributors, retailers, and the guy driving a van full of stock. Most businesses only see what their warehouse or ERP reports show, which is a different thing entirely from what's happening at the point of sale.
2. Why does poor field stock visibility distort the inventory turnover ratio?
Inventory turnover is calculated using sales and stock data, but if field-level stock movement isn't captured accurately, primary sales (orders to distributors) get mistaken for actual consumer demand. This inflates turnover on paper even when products are sitting unsold in the field, giving businesses a false sense of how fast inventory is really moving.
3. How does inaccurate field data affect stock cover (days of supply)?
Stock cover only works if you know exactly how much inventory exists at a given moment. Miss that, and the number breaks in both directions at once. Distributors hoarding stock, vans nobody's tracking, reports that trickle in a week late, all of it means stock cover can look too high (because excess stock is hiding somewhere) and too low (because some stock isn't accounted for anywhere) at the same time. That's what leads to bad replenishment calls.
4. What are the business risks of relying on distorted inventory turnover and stock cover numbers?
Distorted metrics lead to inaccurate demand forecasting, tied-up working capital, and the paradox of stockouts and overstocking happening at the same time across different outlets. Over time, this erodes profitability and makes data-driven decision-making unreliable, since the numbers founders and planners rely on don't reflect ground reality.
5. How does Delta Sales App help improve field stock visibility and inventory accuracy?
Delta Sales App's DMS and SFA modules capture real-time secondary sales and stock data directly from distributors, retailers, and field reps, closing the gap between primary orders and actual sell-through. This allows businesses to calculate inventory turnover and stock cover based on real market movement rather than delayed or manual reports, reducing the risk of stockouts, overstocking, and misallocated capital.