How to Identify Slow-Moving SKUs Before They Kill Your Cash Flow

Inventory is often referred to as a business's lifeblood, and for good reason. Every product on your shelves represents potential revenue, but it also represents money invested, space taken up, and resources expended. For many businesses, particularly those in retail, FMCG, and distribution, the most significant hidden threat is not poor overall sales, but rather slow-moving SKUs lurking quietly in their inventory.
These products don't just sit on shelves; they reduce cash flow, raise storage costs, and lower profitability. In some cases, slow-moving SKUs can quietly erode a company's financial health before anyone realizes. Imagine stocking hundreds of products only to discover that one-third of them barely sell each month; that's a waste of money, space, and time.
What is the good news? Slow-moving SKUs do not have to drain your revenue. Understanding how to identify them early, analyzing the right data, and taking targeted action can help you transform inventory from a liability to a strategic advantage.
In this guide, we’ll walk you through everything you need to know:
-
What slow-moving SKUs are and why they matter
-
The key metrics and data points to watch
-
Step-by-step methods to identify problem products
-
Actionable strategies to move inventory and protect cash flow
-
How technology like Delta Sales App can make the process faster and smarter
By the end of this post, you’ll not only know which products are slowing you down, but also how to take control of your inventory, improve profitability, and keep your business running smoothly.
What Are Slow-Moving SKUs?
A Stock Keeping Unit (SKU) is a unique identifier for each product in your inventory. Businesses use SKUs to track sales, stock levels, and movement trends.
A slow-moving SKU is an item that sells more slowly than expected, compared to your other products. These are the items that linger on shelves or in warehouses without generating meaningful revenue.
Common Characteristics of Slow-Moving SKUs:
-
Low or declining sales over a period of weeks or months
Slow-moving SKUs usually experience a consistent drop in sales volume over time. Instead of generating consistent orders, these items sell infrequently or not at all. This decline could be due to reduced customer demand, increased competition, or ineffective marketing efforts. Tracking sales patterns over weeks or months allows businesses to identify these SKUs early and take corrective action before they affect overall performance.
-
Inventory sitting beyond expected lifecycle
Every product has an expected lifecycle, which is the average amount of time it should be in inventory before being sold. Slow-moving SKUs go unsold after this time frame, increasing the risk of product damage, expiration, or obsolescence. For example, seasonal products that remain unsold after their peak demand period are frequently classified as slow-moving inventory. Monitoring inventory aging reports enables businesses to identify products that exceed their lifecycle expectations.
-
Minimal contribution to overall revenue
Slow-moving SKUs often contribute very little to total business revenue despite occupying storage space and operational resources. While they may represent a significant portion of inventory, their low sales volume means they do not generate enough profit to justify their costs. Identifying such SKUs allows businesses to prioritize high-performing products and optimize their product portfolio.
-
High holding and storage costs relative to turnover
Slow-moving SKUs are often symptoms of deeper operational challenges such as inaccurate demand forecasting, ineffective product placement, pricing mismatches, or shifts in customer preferences and market trends. Identifying the root cause helps businesses implement long-term solutions instead of temporary fixes.
Slow-moving SKUs are frequently the result of larger operational issues, such as forecasting errors, poor product placement, pricing issues, or market changes.
Why Slow-Moving SKUs Are a Threat to Cash Flow
Identifying slow-moving SKUs is more than just an inventory exercise; it is a financial necessity. Cash flow is the lifeblood of any company. It determines your ability to pay suppliers, invest in expansion, run marketing campaigns, manage payroll, and capitalize on market opportunities.
When inventory stops moving, so does cash. Slow-moving SKUs quietly lock up resources and create financial pressure that many businesses fail to notice until it becomes a major issue.
Let’s break down why
1. Tied-Up Capital
Each product in your warehouse represents money that has already been spent. Each product in your warehouse represents money that has already been spent. That money has been paid to suppliers, manufacturers, and distributors, but it has yet to be repaid through sales. That money has been paid to suppliers, manufacturers, and distributors, but it has yet to be repaid through sales.
When SKUs Move Slowly:When SKUs Move Slowly:
-
Your working capital remains locked in unsold inventory. Your working capital remains locked in unsold inventory.
-
You have lower liquidity for high-demand products. You have lower liquidity for high-demand products.
-
Expansion opportunities are delayed. Expansion opportunities are delayed.
For example, if 25% of your inventory budget is allocated to slow-moving SKUs, that means 25% of your capital is not being returned. For example, if 25% of your inventory budget is allocated to slow-moving SKUs, which means 25% of your capital is not being returned. Over time, this constrains growth and limits reinvestment in better-performing products. Over time, this constrains growth and limits reinvestment in better-performing products.
2. Increased Storage Costs
Inventory isn’t free to hold. The longer products sit in storage, the more they cost you. Holding costs include:
-
Warehouse rent or storage space
-
Utilities and maintenance
-
Insurance
-
Handling and labor
-
Inventory management systems
These expenses accumulate daily. A slow-moving SKU with low turnover means you’re paying storage costs for months without generating revenue from it.
The real danger? These carrying costs often remain hidden in operational budgets, making it harder to see how much profit is quietly eroding.
3. Risk of Obsolescence
Products can quickly lose relevance in rapidly changing markets, particularly in technology, fashion, electronics, and fast food. If inventory doesn’t sell within its peak demand window:
-
Newer models replace it
-
Trends shift
-
Customer preferences evolve
-
Expiry dates approach
When this occurs, businesses are forced to significantly discount products or write them off entirely. That entails accepting lower margins or complete loss. Obsolete inventory not only reduces profits but also has a direct impact on cash recovery.
4. Negative Impact on Financial Health
Slow-moving SKUs reduce your inventory turnover ratio, which is a key performance indicator for operational efficiency. Low turnover signals poor inventory utilization and weak demand alignment. The financial consequences include:
-
Reduced liquidity
-
Difficulty paying suppliers on time
-
Strained vendor relationships
-
Lower creditworthiness
-
Limited ability to seize new opportunities
In worst-case scenarios, persistent slow-moving inventory can create cash flow gaps that require short-term borrowing, increasing financial risk even further. Simply put, slow SKUs hurt your balance sheet, reduce profitability, and limit business agility.
Metrics to Identify Slow-Moving SKUs
Identifying slow-moving SKUs requires data-driven decision-making. Businesses that do not track the right metrics frequently discover inventory issues after their cash flow has already been strained.
By consistently monitoring the following KPIs, you can identify slow-moving products and take corrective action before they affect profitability.
1. Inventory Turnover Ratio
The inventory turnover ratio measures how frequently inventory is sold and replenished within a specific period (usually annually). It indicates how efficiently a business converts stock into sales.
Formula:
Inventory Turnover = Cost of Goods Sold (COGS) ÷ Average Inventory
A low turnover ratio suggests products are sitting in stock longer than they should. This can signal weak demand, overstocking, or ineffective sales strategies. Example: If your turnover ratio is 2× per year, but your industry average is 5×, your inventory is moving significantly slower than competitors. This gap often indicates excess capital tied up in slow-moving SKUs.
2. Days of Inventory on Hand (DOH)
Days of Inventory on Hand (DOH) measures the average number of days a product remains in inventory before being sold.
Formula:
DOH = (Average Inventory ÷ Cost of Goods Sold) × 365. A higher DOH means inventory is sitting longer in storage. The longer it stays, the higher the financial risk.
For example:
-
30–60 days may be normal for FMCG
-
90+ days could signal slow movement
-
180+ days often indicates serious stagnation
High DOH directly affects cash flow because capital remains locked in stock instead of being reinvested into faster-moving products.
3. Sell-Through Rate
The sell-through rate measures how much inventory you’ve sold compared to how much you received during a specific period.
Formula:
Sell-Through Rate = (Units Sold ÷ Units Received) × 100. This metric is particularly useful for short-term performance analysis. For example:
-
A 70% sell-through rate in a quarter indicates strong demand
-
A 20% sell-through rate signals potential slow movement
Products with less than 20–30% sell-through in a quarter may require intervention through pricing adjustments, promotions, or redistribution.
Sell-through is highly valuable in retail and FMCG industries, where sales velocity changes rapidly.
4. Inventory Aging Reports
Inventory aging reports categorize products based on how long they’ve been in stock, typically in buckets such as
-
0–30 days
-
31–60 days
-
61–90 days
-
90–180 days
-
180+ days
These reports help businesses identify SKUs that are gradually becoming slow movers before they become obsolete. For example, if a large percentage of your inventory falls into the 90+ day category, it’s a warning sign that purchasing decisions may not align with actual demand. Aging reports are particularly powerful because they highlight patterns across product categories, not just individual SKUs.
5. ABC Analysis
ABC analysis categorizes products based on revenue contribution and sales movement.
-
A Items: High revenue, high movement (top-performing SKUs)
-
B Items: Moderate revenue and movement
-
C Items: Low revenue, low movement
Typically:
-
A items make up about 20% of SKUs but generate 70–80% of revenue
-
C items often represent a large portion of inventory but contribute minimal revenue
Focusing on C items helps identify products that are tying up space and capital without delivering proportional returns. However, ABC analysis should be dynamic; some B items may trend downward and eventually become C items if not monitored.
Step-By-Step Process to Identify Slow-Moving SKUs
A systematic approach helps you move from reactive inventory management to proactive cash flow protection.
Here’s how to do it properly
Step 1: Gather Data Across Channels
Complete and centralized data is essential for identifying slow-moving SKUs.
Many businesses make the mistake of analyzing inventory in silos, which means reviewing warehouse data separately from POS or e-commerce transactions. This causes blind spots.
You should collect data from:
-
POS systems (retail store sales)
-
E-commerce platforms
-
Field sales orders
-
Warehouse stock levels
-
Historical sales records
-
Returns and damaged goods reports
An SKU may appear slow in retail stores but perform well in online channels, or vice versa. Without unified data, you risk making incorrect decisions such as unnecessary discounting or discontinuation.
Step 2: Segment Products Using ABC Analysis
Once data is centralized, the next step is prioritization. ABC analysis categorizes SKUs based on their revenue contribution and sales movement:
-
A Items: High-value, fast-moving products
-
B Items: Moderate revenue and movement
-
C Items: Low-value, slow-moving products
While C items are typically the main focus for slow-mover analysis, it’s equally important to monitor B items that show declining trends. Today’s B item can become tomorrow’s C item if demand drops. This segmentation helps you: Focus attention where it matters most. Allocate resources efficiently. Avoid overanalyzing high-performing products The goal is not just to identify poor performers but to identify early warning signals.
Step 3: Calculate Metrics Per SKU
Now it’s time for detailed SKU-level evaluation. For each SKU, calculate:
-
Inventory Turnover Ratio
-
Days of Inventory on Hand (DOH)
-
Sell-Through Rate
-
Sales Velocity (units sold per week/month)
This granular approach allows you to compare products within the same category. For example: If two similar products exist but one has
-
45 DOH and 60% sell-through.
And the other has: -
120 DOH and 20% sell-through
The second SKU clearly demands attention. Tracking these metrics monthly (or even weekly for FMCG businesses) prevents slow-moving inventory from going unnoticed.
Step 4: Identify Patterns
Metrics alone are not enough; trends tell the real story. Look for patterns such as:
-
Seasonal fluctuations (e.g., winter products after peak season)
-
Gradual decline in sales velocity
-
Increasing stock levels without matching sales growth
-
High return rates
-
Certain regions underperforming compared to others
Trend analysis helps differentiate between:
-
Temporary slowdowns
-
Seasonal dips
-
Structural demand decline
For example, a product that slows down every off-season may not necessitate discontinuation but rather better forecasting and stocking strategies.
Visual dashboards and SKU heatmaps make pattern identification significantly easier.
Step 5: Predictive Analytics
The most advanced step is shifting from identification to prediction. Instead of waiting for SKUs to become slow movers, predictive analytics helps forecast:
-
Future demand decline
-
Overstock risk
-
Seasonal impact
-
Changing buying behavior
By analyzing historical patterns, reorder frequency, and velocity changes, businesses can flag SKUs likely to stagnate in upcoming months.
Common Causes of Slow-Moving SKUs
Identifying slow-moving SKUs is only part of the solution. To truly protect cash flow, businesses must understand why certain products don't sell as expected.
In most cases, slow-moving inventory is not an accident; it is a symptom of more serious operational, strategic, or market issues.
Understanding the root cause enables you to take the appropriate corrective action rather than relying on temporary solutions such as blanket discounts.
Let's look at the most common causes.
1. Poor Demand Forecasting
One of the leading causes of slow-moving SKUs is inaccurate demand forecasting.
When businesses overestimate demand, they purchase or produce more inventory than the market can absorb. This leads to excess stock sitting in warehouses for extended periods.
Common forecasting mistakes include:
-
Relying only on historical sales without considering market shifts
-
Ignoring seasonality patterns
-
Failing to adjust forecasts after promotions
-
Not accounting for regional demand differences
Overstocking ties up capital and creates pressure to clear inventory through markdowns, reducing margins.
Improving forecasting accuracy through data analytics and real-time sales tracking significantly reduces the risk of creating slow movers.
2. Seasonality Misalignment
Many products experience natural seasonal demand cycles. Problems arise when inventory planning does not align with those cycles.
For example:
-
Winter apparel stocked too heavily in spring
-
Festival-specific items remaining after peak season
-
Seasonal FMCG products ordered in excess
When products miss their peak demand window, they are automatically classified as slow-moving SKUs.
The solution does not always involve discontinuation; it could be better seasonal planning, smaller batch ordering, or more dynamic replenishment strategies.
3. Product Placement & Merchandising Issues
Even high-quality products can become slow movers if customers don’t see them. In physical retail environments:
-
Poor shelf positioning reduces visibility
-
Inadequate display space lowers engagement
-
Unattractive packaging may discourage purchase
In e-commerce:
-
Weak product descriptions
-
Poor search optimization
-
Low-quality images
-
Limited customer reviews
Sales will suffer if a product is difficult to locate or poorly presented, regardless of potential demand.
Improving merchandising, digital visibility, and product positioning can frequently revitalize slow-moving SKUs without altering the product itself.
4. Pricing & Promotional Gaps
Pricing plays a critical role in product movement. If a product is priced higher than competitors without clear value differentiation, customers may choose alternatives. Similarly, lack of promotion can reduce visibility and urgency. Common pricing-related causes include:
-
Failure to adjust prices based on market conditions
-
Not benchmarking against competitors
-
Ignoring price sensitivity data
-
Infrequent promotional campaigns
Strategic promotions, bundle offers, and limited-time discounts can help accelerate movement—but they should be guided by data, not panic.
5. Market Competition & Changing Trends
Markets evolve rapidly. Consumer preferences shift, new competitors emerge, and innovative alternatives enter the market.
A product that once sold well may slow down because:
-
A competitor offers better features
-
A substitute product gains popularity
-
Customer tastes change
-
Technology advances
Industries like fashion, electronics, and FMCG are especially vulnerable to trend-driven demand shifts. Monitoring competitor activity and market trends helps businesses anticipate demand changes rather than react after inventory stagnates.
How Delta Sales App Helps Identify Slow-Moving SKUs
Manually tracking inventory and SKU performance is not only time-consuming but also error-prone. Using spreadsheets or fragmented data systems in businesses with multiple sales channels, warehouses, and distributors can easily lead to missed insights and cash flow issues.
Delta Sales App addresses this issue by providing an integrated, real-time solution that allows businesses to identify, monitor, and act on slow-moving SKUs before they negatively impact
Here’s how:
-
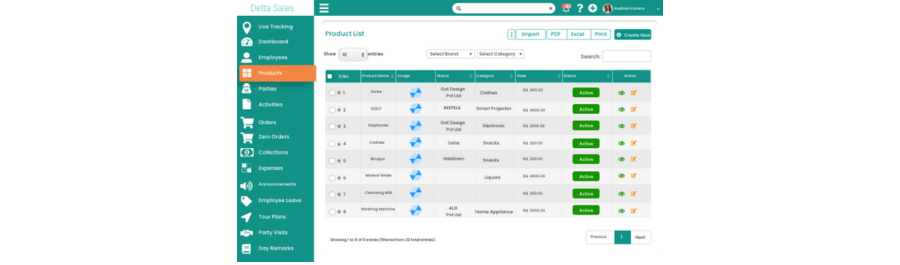
Real-Time SKU Performance Dashboards
The Delta Sales App provides centralized dashboards that track SKU performance across all sales channels. You can monitor sales velocity, inventory levels, turnover ratios, and historical performance at a glance. The dashboards also visualize trends with charts, graphs, and heatmaps, enabling managers to quickly identify slow movers without waiting for end-of-month reports.
-
Automated Alerts for Slow-Moving Products
Manually reviewing hundreds or thousands of SKUs is inefficient. The inventory management system automates the monitoring process by sending alerts for slow-moving products. You receive notifications when SKUs exceed expected inventory days (DOH), show declining sell-through rates, or trend toward obsolescence. These automated alerts allow managers to take proactive actions such as promotions, reallocation, or procurement adjustments before inventory becomes a cash flow burden.
-
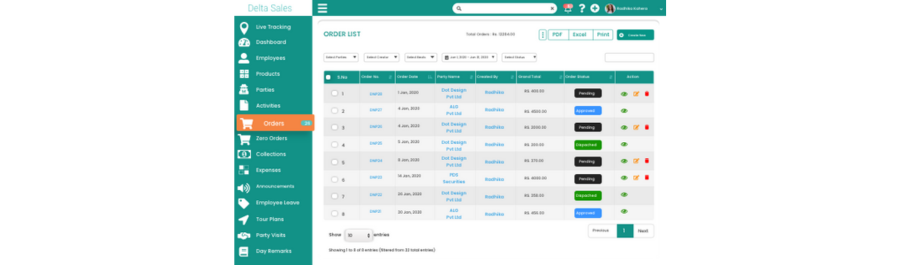
Integration Across Sales Channels
One of the biggest challenges in inventory management is fragmented data. Slow-moving SKUs often go unnoticed because information is scattered across retail stores, e-commerce platforms, distributors, and warehouses. The Delta Sales App integrates seamlessly across all channels, giving businesses a unified view of SKU performance. This ensures that underperforming products are detected no matter where they exist in the supply chain.
-
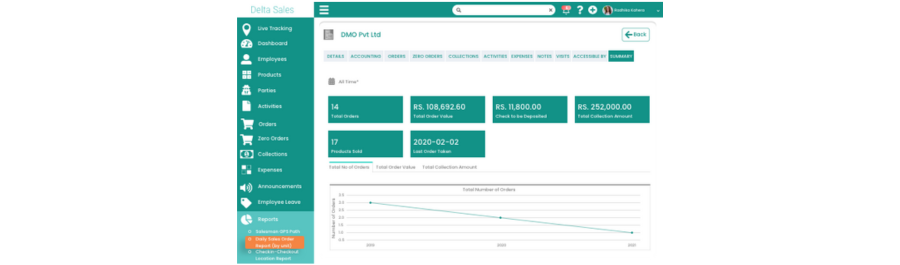
Predictive Analytics to Forecast Slow Movers
Delta Sales App goes beyond tracking historical data by offering predictive analytics. It forecasts which SKUs are likely to slow down in the coming weeks or months by analyzing sales velocity, seasonal trends, and regional demand patterns. Businesses can then adjust procurement, plan promotions, or reallocate inventory proactively. This turns slow-moving SKUs into an opportunity rather than a liability.
Strategies to Manage Slow-Moving SKUs
Once slow-moving SKUs are identified, businesses can take targeted actions to mitigate their impact on cash flow and profitability. Implementing the right strategies ensures inventory becomes a strategic asset rather than a liability.
-
Strategic Discounts
One of the most common approaches is to offer limited-time discounts or promotional pricing. By reducing the price temporarily, you create urgency among customers to purchase slow-moving items. Another effective approach is to bundle slow movers with high-demand products, encouraging sales without heavily discounting individual items. Strategic discounts help convert stagnant inventory into cash while maintaining profitability.
-
Product Bundling
Bundling slow-moving SKUs with popular products is a smart way to increase perceived value and accelerate sales. For example, pairing a slow-moving accessory with a bestselling product encourages customers to buy both items together. Bundling not only moves stagnant inventory but also enhances overall sales and strengthens customer satisfaction.
-
Inventory Reallocation
Sometimes slow-moving SKUs underperform in certain locations but sell well in others. Reallocating inventory to high-demand stores, regions, or online channels can help clear stock efficiently. By analyzing sales trends and regional performance data, businesses can ensure that products are stocked where they are most likely to sell, reducing storage costs and improving turnover.

-
Enhanced Marketing
Investing in marketing can breathe new life into slow-moving SKUs. Refreshing product images, updating descriptions, running promotions, or highlighting items on websites and social media can increase visibility and attract customer attention. Well-crafted marketing campaigns can turn overlooked products into profitable items by simply making them more discoverable and appealing.
-
Vendor Negotiations
In some cases, businesses can negotiate with suppliers or vendors to return unsold stock, obtain markdown allowances, or adjust future orders. Vendor collaboration can significantly reduce financial risk associated with slow-moving SKUs and prevent overstocking in subsequent inventory cycles. Establishing these agreements ensures businesses are not fully burdened by stagnant products.
-
Discontinuation
For products that consistently underperform despite all efforts, discontinuation may be the most practical solution. Removing such SKUs frees up storage space, reduces holding costs, and allows capital to be redirected toward higher-performing items. Discontinuation decisions should be guided by data and aligned with overall business strategy to minimize revenue loss.
Industry-Specific Considerations
-
FMCG & Retail
Fast-moving items are crucial; slow SKUs can immediately impact cash flow. Track daily velocity and adjust shelf space accordingly.
-
Manufacturing & Distribution
Raw materials or slow SKUs can tie up working capital. Use predictive analytics to forecast demand and adjust production runs.
-
E-Commerce
Slow SKUs occupy storage and increase shipping complexity. Optimize warehouse layout and visibility online to improve movement.
Conclusion
Slow-moving SKUs can quietly drain cash flow, increase holding costs, and reduce profitability, but identifying them early and taking targeted action can turn these challenges into opportunities. By tracking key metrics, analyzing trends, and implementing strategies like discounts, bundling, or inventory reallocation, businesses can optimize stock, improve turnover, and protect cash flow. Leveraging tools like the Delta Sales App makes this process faster, more accurate, and proactive.
Take control of your inventory today. Book a demo with the Delta Sales App and start optimizing your SKUs for maximum profitability.