How to Calculate the ROI of Your In-Store Promoter Program (And Where Brands Lose Money Without Knowing It)
In today’s highly competitive retail environment, success is often decided at the store level. Brands may invest significantly in distribution networks, trade promotions, and marketing initiatives, but the final point of influence, the in-store promoter, continues to be one of the least measured and least optimized assets.
Despite deploying promoters across hundreds of outlets, most brands struggle to answer a fundamental question:
Are our promoters truly driving profitable outcomes?
This is exactly why understanding and accurately calculating in-store promoter ROI is essential. More importantly, it brings to light the hidden inefficiencies that silently drain budgets and reduce overall program effectiveness without being immediately visible in reports.
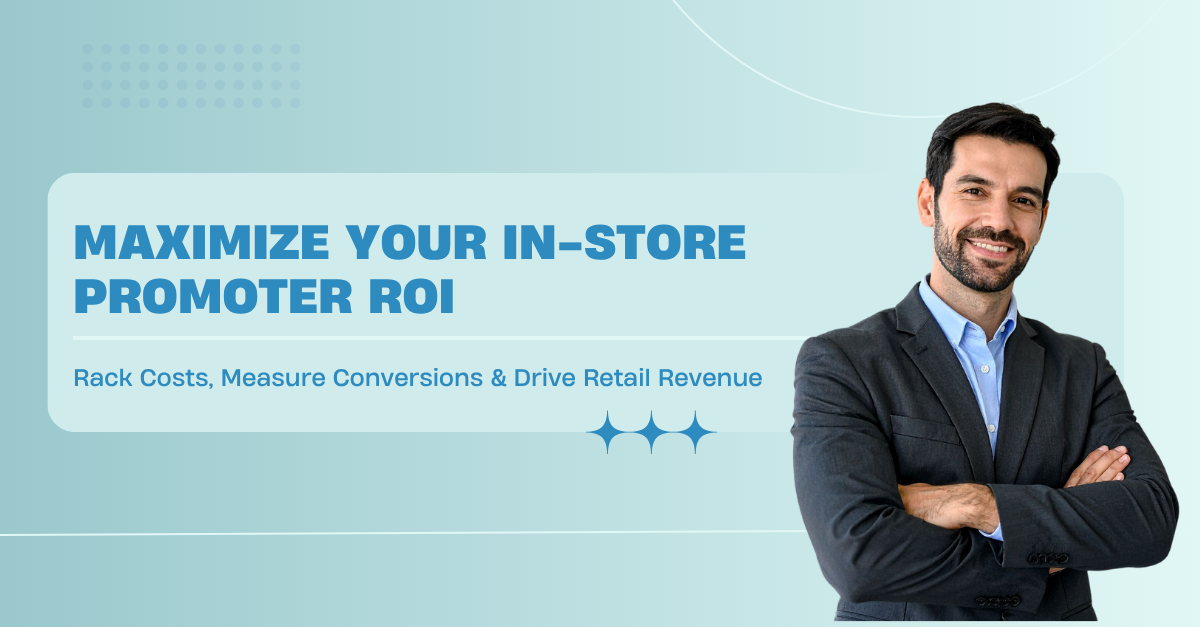
What Does Running an In-Store Promoter Program Actually Cost?
Before you can accurately calculate returns, you need a clear understanding of what you are actually investing. One of the most common mistakes brands make is evaluating ROI based only on visible costs like salaries and incentives, while ignoring the broader cost structure that supports the entire program.
In reality, running an in-store promoter program involves multiple cost layers, fixed, variable, and operational overheads, all of which contribute to the final investment. Missing even one of these layers can lead to overestimated ROI and poor strategic decisions.
Let’s break this down in detail.
1. Fixed Costs: The Foundation of Your Program
Fixed costs are recurring and predictable. These form the backbone of your promoter operations and remain relatively stable regardless of short-term fluctuations in activity.
a. Promoter Salaries
This is the most visible and often the largest component of your investment.
It typically includes:
- Monthly wages across different territories and store formats
- Overtime payments during peak sales periods or high-footfall days
- Additional compensation for weekend shifts, festivals, or extended store hours
While salaries are easy to track, they only represent a portion of the total cost and relying solely on them for ROI calculations can be misleading.
b. Training and Onboarding
Promoters are the face of your brand inside the store. Their ability to influence purchase decisions depends heavily on how well they are trained.
Training costs usually include:
- Product knowledge sessions to ensure accurate communication
- Sales training focused on customer engagement and conversion
- Grooming and behavioral training to maintain brand image
- Trainer fees, venue costs, and training materials
This is not a one-time expense. Continuous training is often required for:
- New product launches
- Scheme updates
- Skill enhancement
c. Branding and Uniforms
Consistency in brand presentation is critical at the retail level. Promoters must visually align with your brand identity.
These costs include:
- Branded uniforms or apparel
- ID cards and accessories
- Demo kits used during product promotions
- Merchandising materials such as display props and signage
Although these may seem like minor expenses individually, they add up significantly across large teams.
2. Variable Costs: Scaling with Activity
Variable costs fluctuate depending on the scale of operations, campaign intensity, and market conditions. These costs tend to increase as you push for higher sales or expand coverage.
a. Incentives and Performance Bonuses
To drive motivation and performance, brands often implement incentive structures.
These may include:
- Sales-linked commissions based on targets achieved
- Performance bonuses for exceeding goals
- Seasonal or campaign-based rewards during peak periods
While incentives are essential for boosting productivity, they must be closely monitored to ensure they are delivering proportional returns.
b. Travel and Logistics
Promoter programs often involve movement across multiple stores or locations, especially in general trade environments.
Associated costs include:
- Daily commute reimbursements
- Travel allowances for visiting multiple outlets
- Expenses for audits, store checks, or new market activations
In geographically dispersed markets, these costs can become substantial.
c. Sampling and Demo Costs
Product demonstrations are a key part of promoter activity, particularly in FMCG and personal care categories.
These costs include:
- Free product units distributed as samples
- Demo setup materials such as stands, testers, or equipment
- Promotional giveaways to attract customer attention
While demos can significantly improve conversion rates, untracked or inefficient sampling can quickly inflate costs without delivering measurable returns.
3. Operational Overheads: The Hidden Layer
This is where most brands underestimate their investment. Operational overheads are not always directly linked to promoters, but they are essential for running the program effectively.
These include:
- Salaries of field supervisors, team leaders, and regional managers
- Backend coordination and administrative teams
- Communication tools such as mobile usage, apps, and reporting systems
- Time and effort spent on compiling, verifying, and analyzing reports
These overheads often remain invisible in basic cost calculations but can account for a significant portion of the total budget.
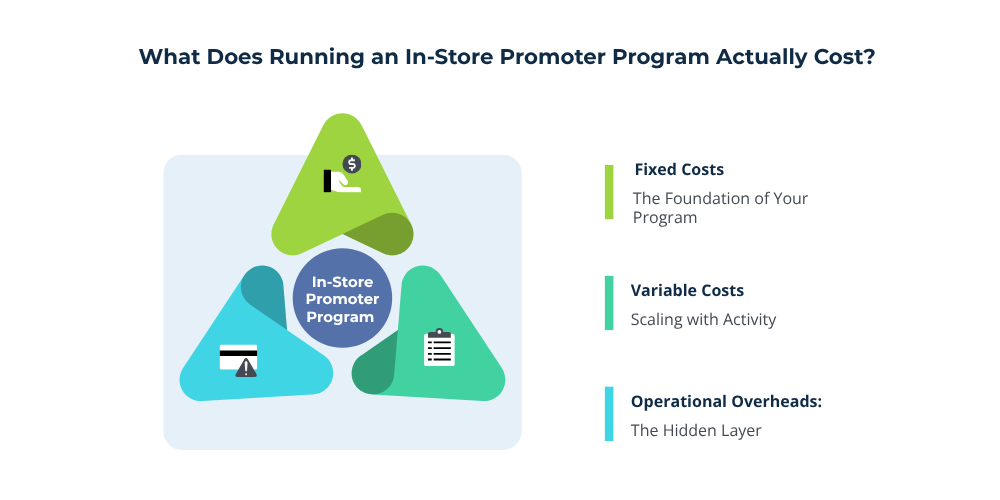
How to Calculate In-Store Promoter ROI (Step-by-Step)
Understanding the cost of your promoter program and identifying hidden inefficiencies is only half the job. The real value lies in being able to accurately calculate your in-store promoter ROI, so you can determine whether your investment is truly delivering returns or quietly draining resources.
However, calculating ROI in promoter-led retail environments is not always straightforward. Unlike digital campaigns where attribution is clear, in-store performance depends on multiple variables, human effort, store conditions, customer behavior, and execution quality.
This is why a structured, step-by-step approach is essential.
Step 1: Start with a Clear ROI Formula
At its core, ROI is a measure of profitability. For promoter programs, the standard formula is:
ROI (%) = (Incremental Revenue – Total Program Cost) ÷ Total Program Cost × 100
This formula helps you understand how much return you are generating for every rupee invested.
But the key here is not just applying the formula, it’s ensuring that both inputs, incremental revenue and total cost, are accurate and reliable.
Step 2: Establish Your Total Program Cost
Before you measure returns, you need a complete and realistic view of your investment.
This includes:
- Fixed costs like salaries, training, and uniforms
- Variable costs such as incentives, travel, and sampling
- Operational overheads including supervision, admin, and reporting
Many brands make the mistake of excluding indirect costs, which leads to inflated ROI figures. A comprehensive cost structure ensures that your ROI reflects reality, not assumptions.
Step 3: Measure Incremental Revenue (Not Just Total Sales)
This is the most critical step in the entire process.
You are not trying to measure total sales, you are trying to isolate the additional revenue generated specifically because of promoter activity.
There are several ways to approach this:
Before vs After Analysis
Compare store sales before and after deploying promoters. The difference gives an estimate of promoter-driven uplift.
Test vs Control Stores
Evaluate similar stores, one set with promoters and one without. The performance gap indicates the promoter’s contribution.
Demo-Based Conversion Tracking
Track how many customer interactions or product demos actually lead to purchases. This gives a direct link between effort and revenue.
While none of these methods are perfect in isolation, combining them provides a much more accurate picture of true incremental impact.
Step 4: Track the Right Performance Metrics
To calculate ROI effectively, you need strong input data. This is where using an in-store promoter management app becomes critical, as it helps capture real-time productivity, sales, and execution data without manual errors.
Instead of relying on assumptions, you should track:
Productivity Metrics
- Number of stores visited per day
- Time spent in each store
- Number of demos conducted
Sales Metrics
- Units sold per promoter
- Revenue generated per visit
- Conversion rate from demo to purchase
Execution Metrics
- Shelf compliance percentage
- SKU availability
- Visibility and display scores
These metrics help bridge the gap between activity and outcome, making your ROI calculation far more accurate.
Step 5: Attribute Sales to Promoter Activity
Once you have performance data, the next step is to connect promoter effort to actual sales outcomes.
This can be done by:
- Mapping store visits with sales spikes
- Linking demo activity with conversion data
- Comparing performance trends across time periods
In advanced setups, promoter performance management software can automatically attribute sales to specific activities, removing manual guesswork and improving precision.
Step 6: Apply the ROI Formula
With all inputs in place, you can now calculate ROI.
For example:
- Total program cost: ₹5,00,000
- Incremental revenue: ₹8,50,000
ROI = (8,50,000 – 5,00,000) ÷ 5,00,000 × 100 = 70%
This means your promoter program is generating a 70% return on investment.
Step 7: Break Down ROI for Deeper Insights
A single ROI number doesn’t tell the full story. To make this analysis actionable, you need to break it down further.
Evaluate ROI across:
- Regions or territories
- Store formats (modern trade vs general trade)
- Individual promoters
- Product categories
This helps you identify:
- High-performing markets to scale
- Underperforming areas that need correction
- Top promoters whose practices can be replicated
Step 8: Continuously Optimize Your Program
ROI calculation should not be a one-time exercise. It should become a continuous feedback loop.
Use insights to:
- Improve training and onboarding
- Refine incentive structures
- Optimize store allocation and routing
- Eliminate inefficiencies like missed visits or poor execution
Over time, this leads to higher productivity, better execution, and stronger returns.
Calculating in-store promoter ROI is not just about numbers, it’s about gaining control over your retail execution.
When done correctly, it allows you to:
- Move from assumption-based decisions to data-driven strategies
- Identify and eliminate revenue leakages
- Improve promoter productivity and accountability
- Transform your promoter program from a cost center into a measurable growth driver
In a retail environment where margins are tight and competition is intense, this level of clarity is no longer optional, it’s a competitive necessity.
What Good Looks Like: Industry Benchmarks You Should Track
Without benchmarks, even a well-calculated in-store promoter ROI lacks real meaning. A 60% or 80% ROI may look impressive but is it actually good for your category, market, or execution model?
That’s why benchmarking is essential. It helps you compare your promoter program against industry standards, identify performance gaps, and understand whether your execution is truly optimized or just average.
Below are the key benchmarks every brand should track to evaluate and improve promoter performance.
1. Store Visit Frequency
Store coverage is the starting point of effective retail execution. If your promoters are not consistently present across assigned outlets, your entire strategy weakens.
Industry Benchmarks
- General Trade (GT):
Promoters should ideally visit 8–12 outlets per day, depending on geography and store density. This level of coverage is critical for maintaining strong visibility and consistent execution in General Trade environments. - Modern Trade (MT):
Typically 1–2 stores per day, as these require longer engagement and deeper involvement. Success in Modern Trade depends on structured planning and deeper in-store engagement to maximize impact per visit.
What Good Looks Like
A high-performing program ensures:
- Every assigned outlet is visited as per schedule
- Promoters follow a structured route plan
- Coverage consistency is maintained across all regions
Why This Matters
Low visit frequency leads to:
- Missed sales opportunities
- Weak retail presence
- Increased competitor visibility
In simple terms, if your promoters are not reaching enough stores, your market coverage and ultimately ROI takes a hit.
2. Demo Conversion Rate
Product demonstrations are one of the most direct ways promoters influence purchase decisions. But the effectiveness of demos lies in their ability to convert interest into actual sales.
Industry Benchmarks
- FMCG categories: 10-25% conversion rate
- Beauty & Personal Care: 20-40% conversion rate
What Good Looks Like
Strong performance in this area means:
- Promoters actively engage customers, not just explain products
- Demos are targeted and relevant to the audience
- A significant percentage of interactions result in purchases
Why This Matters
A low conversion rate indicates:
- Poor communication or selling skills
- Ineffective demo execution
- Wastage of sampling and promotional efforts
Improving conversion directly increases revenue without increasing cost, making it one of the most powerful ROI levers.
3. Shelf Compliance
Even the best promoter cannot sell a product that is not visible or properly placed. Shelf execution plays a crucial role in influencing customer decisions at the point of sale.
Industry Benchmarks
- Acceptable level: 85%+ compliance
- High-performing brands: 95%+ compliance
What Good Looks Like
- Products are placed according to planograms
- High-visibility shelf positioning is maintained
- Promotional displays are correctly executed
- All key SKUs are available and properly arranged
Why This Matters
Poor shelf compliance results in:
- Reduced product visibility
- Lower walk-in conversions
- Weak brand presence compared to competitors
Strong shelf execution ensures that your product is seen, considered, and purchased.
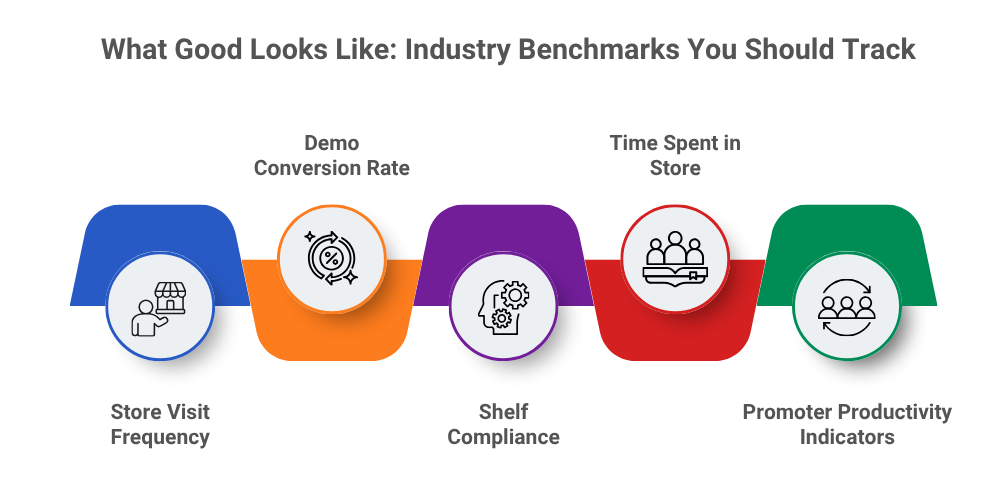
4. Time Spent in Store
The amount of time a promoter spends in a store directly impacts the quality of engagement and execution.
Industry Benchmarks
- Modern Trade: 4–8 hours per store
- (General trade varies but typically involves shorter, more frequent visits)
What Good Looks Like
- Promoters stay for the planned duration
- Time is actively used for customer interaction, demos, and shelf checks
- Engagement is consistent throughout the visit
Why This Matters
Lower-than-expected time in-store often signals:
- Poor discipline or lack of monitoring
- Reduced customer interaction
- Missed opportunities to influence purchase decisions
Time-on-store is not just about presence it’s about depth of engagement, which directly impacts conversions.
5. Promoter Productivity Indicators
Ultimately, the success of your program depends on how effectively individual promoters perform. Productivity metrics help you evaluate both effort and output.
Key Indicators of High Performance
Top-performing promoters consistently demonstrate:
- Higher demo frequency: More customer interactions per day
- Better conversion rates: Turning more interactions into sales
- Stronger compliance scores: Maintaining high standards in shelf execution
What Good Looks Like
- Balanced performance across activity, execution, and sales
- Consistency in output across different stores and time periods
- Ability to adapt to different retail environments and customer profiles
Why This Matters
If productivity varies significantly across promoters:
- Your ROI becomes inconsistent
- High performers carry the program while others underperform
- Scaling becomes difficult without standardization
Tracking these indicators allows you to:
- Identify top performers
- Replicate best practices
- Improve overall team efficiency
How Promoter Management Software Improves Every ROI Lever
By now, it’s clear that in-store promoter ROI depends on multiple moving parts, attendance, store coverage, shelf execution, demo effectiveness, and reporting accuracy. The challenge is not just measuring these elements, but controlling and optimizing them consistently at scale.
This is where an in-store promoter management app to track and improve promoter ROI becomes a game-changer, bringing real-time visibility and accountability into every aspect of execution.
Instead of relying on manual processes and assumptions, modern systems bring real-time visibility, accountability, and data-driven decision-making into your promoter program, directly improving every lever that impacts ROI.
Let’s break down how.
1. Eliminating Fake Attendance and Ensuring Accountability
One of the biggest hidden costs in promoter programs is paying for unverified or fake attendance. Without proper checks, brands often have no way to confirm whether promoters are actually present at assigned stores.
How Software Solves This
- Geo-fencing technology ensures that check-ins can only happen within the store’s location
- Selfie-based verification confirms the promoter’s identity at the time of attendance
- Timestamped logs track exact working hours and visit duration
ROI Impact
- Eliminates payment for non-productive time
- Ensures every working hour contributes to sales
- Builds accountability across the team
2. Ensuring Complete Store Coverage
Missed outlets and inconsistent visits are major contributors to lost sales opportunities. Without structured tracking, it’s difficult to ensure that promoters are covering all assigned locations.
How Software Solves This
- Pre-defined route plans guide promoters on which stores to visit
- Real-time tracking shows which outlets have been covered
- Missed visit alerts notify managers instantly
ROI Impact
- Maximizes retail coverage across territories
- Prevents gaps in market presence
- Ensures consistent brand visibility
3. Improving Shelf Execution and Compliance
Shelf visibility is one of the strongest drivers of in-store sales. However, maintaining consistent execution across hundreds of outlets is nearly impossible without monitoring.
How Software Solves This
- Photo-based reporting captures real-time shelf images
- Planogram compliance tracking ensures correct product placement
- SKU-level visibility checks identify missing or misplaced products
ROI Impact
- Improves product visibility and availability
- Increases walk-in conversions
- Strengthens in-store brand presence
4. Tracking Demo Effectiveness and Conversions
Product demos are a key driver of engagement but without tracking, brands cannot measure their effectiveness.
How Software Solves This
- Demo logging with timestamps and location data
- Customer interaction tracking
- Conversion mapping from demo to sale
ROI Impact
- Identifies which demos are driving results
- Optimizes sampling and promotional strategies
- Improves promoter selling techniques
5. Enabling Real-Time Reporting and Faster Decision-Making
Manual reporting creates delays, errors, and inefficiencies. By the time data reaches decision-makers, it is often outdated.
How Software Solves This
- Automated data capture from the field
- Live dashboards for managers and leadership
- Instant performance insights across regions
ROI Impact
- Reduces time spent on reporting
- Enables faster corrective action
- Improves overall operational efficiency
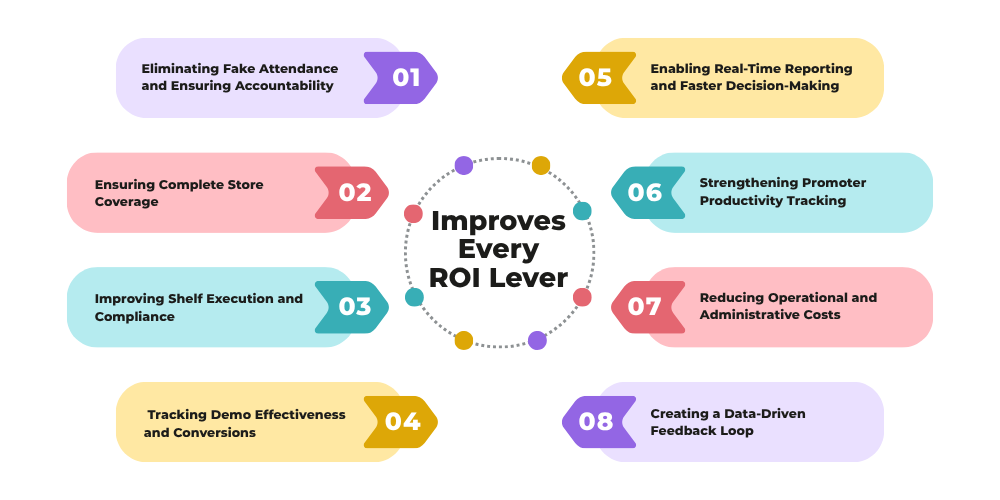
6. Strengthening Promoter Productivity Tracking
Without structured data, it’s difficult to evaluate how individual promoters are performing.
How Software Solves This
- Performance scorecards for each promoter
- KPI tracking (visits, demos, sales, compliance)
- Comparative analysis across teams and regions
ROI Impact
- Identifies high and low performers
- Helps replicate best practices
- Enables targeted training and improvement
7. Reducing Operational and Administrative Costs
A significant portion of promoter program cost comes from backend operations coordination, supervision, and reporting.
How Software Solves This
- Centralized platform for all promoter activities
- Reduced dependency on manual coordination
- Automated workflows and approvals
ROI Impact
- Lowers administrative overhead
- Reduces human error
- Improves scalability of operations
8. Creating a Data-Driven Feedback Loop
Perhaps the biggest advantage of FMCG promoter management software is its ability to create a continuous improvement cycle.
How It Works
- Data is captured in real time
- Insights are generated instantly
- Actions are taken quickly
- Performance improves continuously
ROI Impact
- Faster optimization of strategies
- Continuous improvement in execution quality
- Sustainable growth in program performance
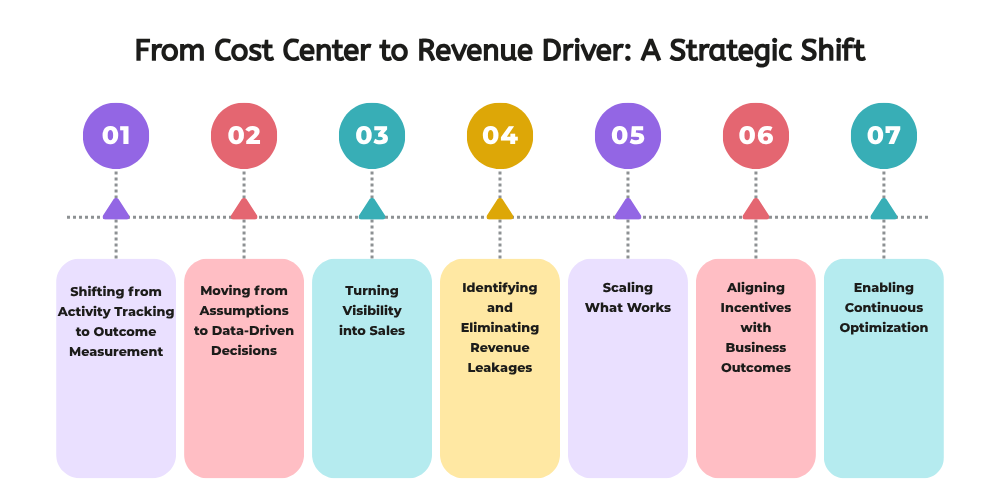
From Cost Center to Revenue Driver: A Strategic Shift
For years, in-store promoter programs have been treated as a necessary expense of doing business in retail rather than a strategic growth lever. Salaries are paid, targets are assigned, reports are submitted but beyond that, very few organizations truly optimize this function.
The reality, however, is fundamentally different.
When measured, managed, and optimized correctly, an in-store promoter program can evolve from a passive cost center into a high-impact revenue engine, one that directly influences conversions, improves retail execution, and drives measurable profitability at the point of sale.
Let’s break down what this transformation actually looks like.
1. Shifting from Activity Tracking to Outcome Measurement
Most brands track activity:
- Number of stores visited
- Attendance logs
- Reports submitted
But activity does not equal impact.
A revenue-driven approach focuses on outcomes:
- Sales generated per promoter
- Conversion rate per demo
- Revenue per store visit
Strategic Shift:
From “Are promoters working?” → to → “Are promoters generating revenue?”
2. Moving from Assumptions to Data-Driven Decisions
In traditional setups, decision-making is often based on:
- Manager feedback
- Manual reports
- Gut feeling
This leads to:
- Misallocation of resources
- Overinvestment in low-performing regions
- Inability to identify revenue leakages
A mature promoter program relies on:
- Real-time performance data
- Store-level insights
- Measurable KPIs
Strategic Shift:
From “We think this market is performing” → to → “We know exactly which stores and promoters are driving ROI”
3. Turning Visibility into Sales
Many brands invest heavily in retail presence, but fail to connect it with actual sales outcomes.
A promoter’s role is not just to stand at the counter, it is to:
- Ensure product availability
- Maintain shelf visibility
- Engage customers at the right moment
When execution improves:
- Visibility increases
- Customer trust improves
- Conversions rise
Strategic Shift:
From “Presence in store” → to → “Performance in store”
4. Identifying and Eliminating Revenue Leakages
One of the biggest reasons promoter programs remain cost centers is invisible inefficiencies, such as:
- Fake or unverified attendance
- Missed store visits
- Poor demo execution
- Out-of-stock products going unreported
Individually, these may seem minor but at scale, they significantly impact ROI.
When tracked and controlled:
- Every promoter hour becomes productive
- Every store visit contributes to revenue
- Every missed opportunity is minimized
Strategic Shift:
From “Untracked inefficiencies” → to → “Controlled, optimized execution”
5. Scaling What Works
Not all promoters perform equally. Not all stores deliver the same results.
Without structured tracking:
- High performers go unrecognized
- Best practices are not replicated
- Scaling becomes inconsistent
With proper data:
- Top-performing promoters can be identified
- Winning strategies can be standardized
- High-ROI stores can be prioritized
Strategic Shift:
From “Uniform execution” → to → “Performance-based scaling”
6. Aligning Incentives with Business Outcomes
In many programs, incentives are loosely defined or poorly tracked, leading to:
- High payouts without proportional returns
- Misaligned promoter behavior
- Focus on activity instead of results
A revenue-focused model ensures:
- Incentives are tied to actual sales performance
- Rewards are linked to conversion and execution quality
- Promoters are motivated to drive measurable outcomes
Strategic Shift:
From “Effort-based incentives” → to → “Outcome-based incentives”
7. Enabling Continuous Optimization
A cost-center mindset is static:
- Budget allocated
- Activities executed
- Reports reviewed
A revenue-driver mindset is dynamic:
- Performance tracked in real time
- Insights generated continuously
- Strategies optimized regularly
This creates a feedback loop where:
- Data → Insights → Action → Improved Performance
Strategic Shift:
From “One-time planning” → to → “Continuous improvement cycle”

What This Transformation Ultimately Delivers
When all these shifts come together, the impact is significant:
- Higher sales per promoter
- Improved conversion rates
- Better retail execution
- Reduced operational wastage
- Stronger accountability across teams
Most importantly, it provides clarity, you know exactly:
- Where your money is going
- What returns it is generating
- How to improve it further
Brands that continue to treat promoter programs as operational expenses will struggle with inefficiencies and inconsistent results. But those that adopt a structured, data-driven approach will unlock a powerful advantage, turning every store visit, every demo, and every interaction into a measurable contributor to revenue.
In an environment where margins are tight and competition is fierce, this is not just an optimization strategy, it’s a necessity for sustainable growth.
Final Thoughts
In-store promoter programs are often under-measured, which makes them appear as cost centers rather than growth drivers. The real issue isn’t investment, it’s the lack of visibility and control.
Once you start accurately tracking ROI, you gain clarity on what’s working, where money is being lost, and how to improve performance. This shift allows you to turn promoter activities into measurable business outcomes and consistent revenue impact.
With Delta Sales App, you can track, measure, and optimize every aspect of your promoter program in real time.
Book a demo today and discover how to eliminate inefficiencies and turn your in-store execution into a revenue driver.


-1785213419-resized320.png)