
How to Measure Sales Force Automation Adoption Across an FMCG Sales Team
Implementing a sales force automation system across the team doesn't mean the team has actually adopted it. A company might have every rep logging attendance on the app while orders still come in over WhatsApp or get written in a notebook. Reps might log a handful of visits and still build the DSR by hand. Managers might have dashboards to look at, but the data behind them is thin because field activity isn't being recorded consistently.
That's a common problem: the business has an SFA platform, not reliable SFA adoption. For FMCG companies, adoption has to be measured by actual field usage, which means looking past login counts and checking whether reps are consistently using the system for visits, attendance, order capture, reporting, route execution, and the rest of their daily work.
In this blog, we will look at the key metrics used to measure SFA adoption across an FMCG sales team, how to identify low adoption, and what sales managers can do to improve usage.
What Is SFA Adoption?
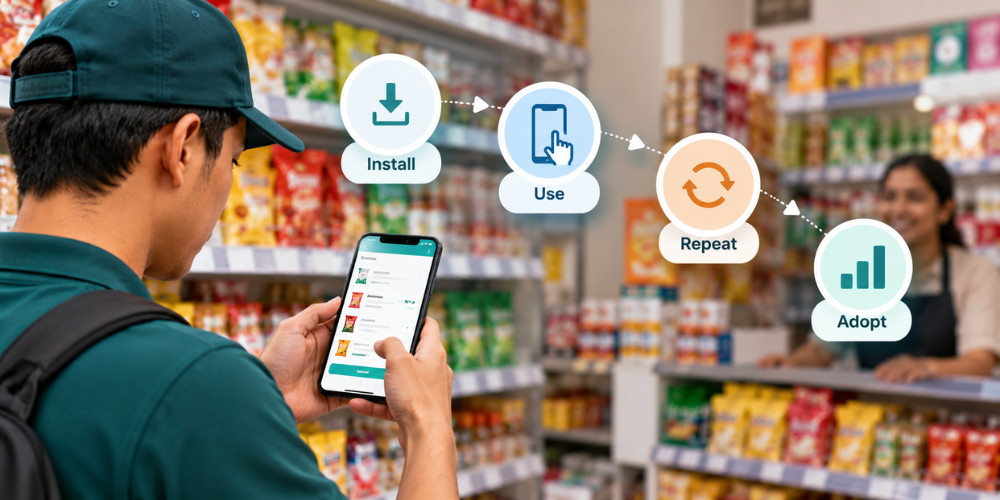
SFA adoption means how consistently and how well a sales team actually uses the system as part of its regular work, not the percentage of people who've installed the app or logged in once. Real adoption looks like this: a rep starts the day by checking the beat plan, records attendance, follows the planned route, visits retailers, captures orders, updates customer activity, and files the end-of-day report, all through the app. The manager then uses that data to check territory coverage, productive calls, orders, collections, and execution.
The more these steps happen through the system, the stronger the adoption. This distinction matters because a company can have a high registration rate and low actual usage at the same time. A business with 100 registered reps and only 50 consistently recording field activity doesn't have 100% adoption, no matter what the registration count says. What counts is how the app is used, not whether it's installed.
Why SFA Adoption Matters for FMCG Sales Teams
FMCG sales run on the quality and frequency of field activity. Reps can visit dozens of retailers in a day, take orders across many SKUs, collect payments, check distributor stock, do merchandising work, and report all of it back to their manager. When the sales force automation system doesn't consistently capture that, managers lose visibility.
A drop in secondary sales might come from poor territory coverage, fewer productive calls, stock problems, weak execution, or just incomplete reporting. Without solid field data, it's hard to tell which one it is.
Strong adoption gives managers a dependable record to work from. They can connect field activity to sales outcomes and dig into performance with actual data, instead of leaning on calls, spreadsheets, and end-of-day conversations with reps. Data quality also affects everything downstream: if half the retailer visits never made it into the system, the territory coverage report is incomplete, and if a lot of orders still get taken outside the platform, SKU-level sales analysis will be too. That's why SFA adoption belongs to sales operations, not to the list of IT implementation metrics.
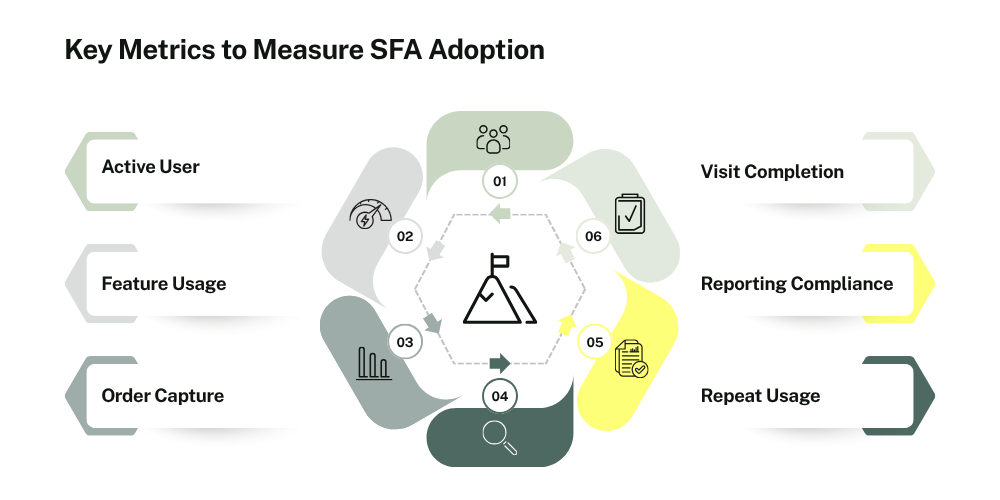
Key Metrics to Measure SFA Adoption
There is no single metric that can accurately describe SFA adoption. A sales manager who looks only at login numbers may believe the team is using the system when important field workflows are still happening manually. A better approach is to measure adoption across the activities that make up the daily sales process.
-
Active Users
The percentage of active users is a useful starting point for understanding how many sales representatives are actually engaging with the SFA platform. A simple calculation is:
Active User Rate = Active SFA Users ÷ Total SFA Users × 100
For example, if an FMCG company has 80 field sales representatives and 68 have actively used the application during the week, the active-user rate is 85%.
However, the company needs to define what counts as an active user. A login alone may not indicate meaningful adoption. A better definition could be a sales representative who completed at least one relevant activity, such as recording a visit, checking in at a retailer, booking an order, or submitting a daily report. This also makes it useful to distinguish between daily and weekly active users. A representative who uses the application once during the week may be technically active, but that does not necessarily mean the system has been adopted as part of the daily field-sales process.
-
App Usage Frequency
Usage frequency shows how often reps actually open the app during the day. For an FMCG field team, managers can check how many working days each rep uses it, how often field activities get recorded, and whether the key workflows get completed as the day goes on.
A rep who uses the app every working day for attendance, visits, orders, collections, and reporting has much stronger adoption than one who opens it just to mark attendance. Timing matters too. If a rep visits 20 retailers during the day but logs all 20 visits late at night, the data ends up in the system, but the system isn't really giving anyone real-time visibility into the field.
-
Field Visits Recorded
Recorded field visits are one of the most practical signals of adoption for FMCG teams, since most sales organizations already have expectations around daily outlet coverage. If a rep is assigned 25 retailer visits and consistently logs only five or six, that's worth asking about. Comparing planned visits to recorded visits shows whether the app is actually being used across the whole route: planned retailer visits, actual visits recorded, productive calls, orders generated, and missed or skipped outlets.
Paired with GPS data, this gets even more useful, since it can tell the difference between a real execution problem and a rep who did the visits but just didn't log them properly.
-
Orders Captured Through the App
Order capture is another strong signal, since taking orders is core to what a rep does every day. If reps are supposed to book orders through the SFA platform, managers can check whether it's become the actual channel for that, looking at orders captured, order value, average order value, orders per productive visit, and SKU-level activity.
Consistency is the thing to watch for. If reps are still taking orders on paper, over the phone, or through messaging apps, and only entering them into the SFA system afterward, the company has digital reporting without real digital order adoption. The order should get captured as part of the retailer visit itself, not reconstructed from memory later.
-
Attendance and Check-In Usage
Attendance is usually the easiest feature to measure, since it has one clear daily action. Managers can see whether reps consistently use the app for daily attendance, start-of-day check-ins, customer check-ins, and other location-based activity. If 95% of expected working days show an app-based attendance record, that's strong adoption of the attendance piece specifically.
But attendance alone doesn't prove overall adoption. A rep can mark attendance every morning and then run the rest of the day on paper orders and a manual DSR. Treat attendance as one piece of a broader adoption picture, not the whole picture.
-
Daily Activity or EOD Report Submission
Daily sales reporting is another important adoption indicator, particularly for FMCG organizations that previously depended on manual DSR collection. When sales representatives submit their daily activity through an SFA system, managers can receive structured information about visits, orders, collections, retailer activity, and other field updates. The business can measure the percentage of expected daily work logs or EOD reports submitted and whether they are submitted within the required timeframe. For example:
EOD Submission Rate = Reports Submitted ÷ Expected Reports × 100
If 50 reports are expected each working day and 42 are submitted, the submission rate is 84%. The quality of those reports should also be considered. A submitted report containing incomplete visit, order, collection, or customer information does not necessarily indicate strong adoption.
-
Use of Key SFA Features
Feature-level usage gives a more detailed picture. An FMCG company might use the SFA platform for beat planning, GPS tracking, attendance, retailer visits, order management, collection reporting, distributor management, expense reporting, retail execution, and DSR submission.
Managers should check which of these features are actually seeing consistent use. Say 96% of reps use attendance, but only 63% log retailer visits and 58% capture orders through the app. That's not a general "app usage" problem; it's specific gaps in specific workflows, and specific gaps need specific fixes. A training issue with order booking needs a different response than a process issue around DSR submission.
How to Measure SFA Adoption Across Your Sales Team
Measuring SFA adoption requires more than checking whether sales representatives are logging into the application. The goal is to understand how consistently the system is being used across daily sales activities and whether usage is improving over time. A structured approach helps sales managers establish a clear baseline, identify adoption gaps, compare usage across teams and territories, and track progress as the SFA process becomes part of regular field operations.
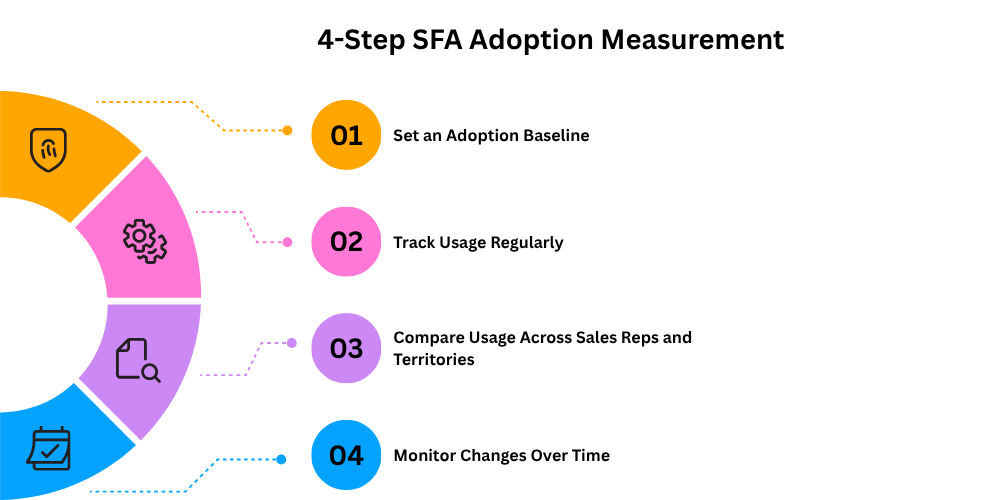
1. Set an Adoption Baseline
First, find out where usage actually stands before setting any targets. That measurement becomes the baseline for comparing future progress. A basic adoption dashboard might look like this:
-
Active users: 86%.
-
Daily app usage: 78%.
-
Field visits recorded: 72%.
-
Orders captured: 69%.
-
Attendance usage: 94%.
-
EOD submission: 81%.
The point of a baseline is that it replaces guesswork with actual numbers. Instead of saying "most of the team is using the app," managers can point to which workflows are strong and which need work. This baseline can be broken out separately by region, distributor, branch, or sales team too.
2. Track Usage Regularly
Adoption needs regular monitoring, since usage can drift after the initial rollout. A team might show strong adoption right after training and then slide back toward manual processes a few months in. Or it might go the other way, improving as reps get more comfortable with the app.
Weekly checks catch these shifts early. Managers can look at active users, recorded visits, order capture, attendance, EOD reporting, and feature usage to see whether the team is moving toward consistent digital execution or drifting away from it. This isn't about creating another report to file. It's about catching where the sales process isn't being followed the way it should be.
3. Compare Usage Across Sales Reps and Territories
An overall adoption number can hide a lot. An organization might report 85% SFA adoption company-wide, while one region is at 96% and another sits at 61%. The same gap shows up at the individual rep level. Comparing usage across reps, territories, branches, distributors, and beats shows managers exactly where the adoption problems are concentrated.
It also puts sales performance in context. A territory with weak sales and weak SFA adoption needs a different fix than a territory with weak sales but strong, consistent field-data capture.
4. Monitor Changes Over Time
Adoption is better tracked as a trend than as one snapshot number. Measure it weekly or monthly and compare against earlier periods, watching how active users, recorded visits, order capture, EOD reporting, and feature usage move over time. If order capture climbs from 64% to 72% to 79% over a few weeks, the team is moving in the right direction.
A sudden drop, on the other hand, could point to a connectivity problem, a workflow change, a technical issue, gaps in onboarding new hires, or managers not following up. Looking at the trend is what tells you whether you're dealing with a temporary blip or a real adoption gap.

Signs Your Sales Team Has Low SFA Adoption
Low adoption isn't always obvious. A team can look like it's using the app while still relying on manual processes for the parts of the sales workflow that matter most. Usage patterns, field activity, order capture, and data quality tell a manager whether the SFA system is genuinely in use or just handling a few basic tasks while the real work still happens off the platform.
-
Infrequent App Usage
If reps only open the app to mark attendance and barely touch it the rest of the day, adoption isn't really there. Another warning sign is a gap between working days and app-usage days. A rep who's supposed to work six days a week but shows meaningful activity on only three isn't actually following the digital workflow.
Watch out for reps who dump a lot of activity into the app at the end of the day instead of recording it as they go through the field.
-
Missing Field Activity
A rep might actually visit retailers and just not log it in the app. That's a visibility problem, since managers can't tell whether the territory was covered or not. If planned beats keep showing missing visits, it's worth digging into why. It could be poor adoption, a connectivity issue, a workflow that's too clunky, or a genuine execution problem where the visits really didn't happen. Missing data in the system shouldn't automatically be read as missing field activity.
-
Low Order or Visit Recording
Low-order or visit recording is another red flag. If the real sales activity is clearly higher than what's showing up in the SFA system, reps are probably still using manual order books, spreadsheets, phone calls, or messaging apps on the side. That weakens the whole platform, since managers can't trust the system for accurate territory or SKU-level analysis, and it hurts visibility into secondary sales, especially where retailer orders are a key source of market information.
-
Incomplete Data
Adoption isn't only about entering data. The data has to be complete enough to actually support decisions. Missing retailer details, SKU quantities, order values, collection information, visit outcomes, or EOD activities usually means reps are only partly completing the workflow. If that's happening often, it's worth checking whether the app is asking for information it doesn't really need or whether reps just haven't been trained properly on the process.
-
Sales Reps Relying on Manual Processes
Continued reliance on manual tools is one of the clearest signs of incomplete SFA adoption. If representatives maintain paper order books, personal spreadsheets, WhatsApp reports, or separate DSR formats alongside the SFA application, the company may have digitized reporting without actually changing the underlying sales process. The answer is not necessarily to demand more data entry. Instead, managers should identify why the manual process continues. It may be faster, easier, more familiar, or perceived as more reliable by the sales team. Removing those barriers is often more effective than simply enforcing application usage.
How to Improve SFA Adoption Among FMCG Sales Reps
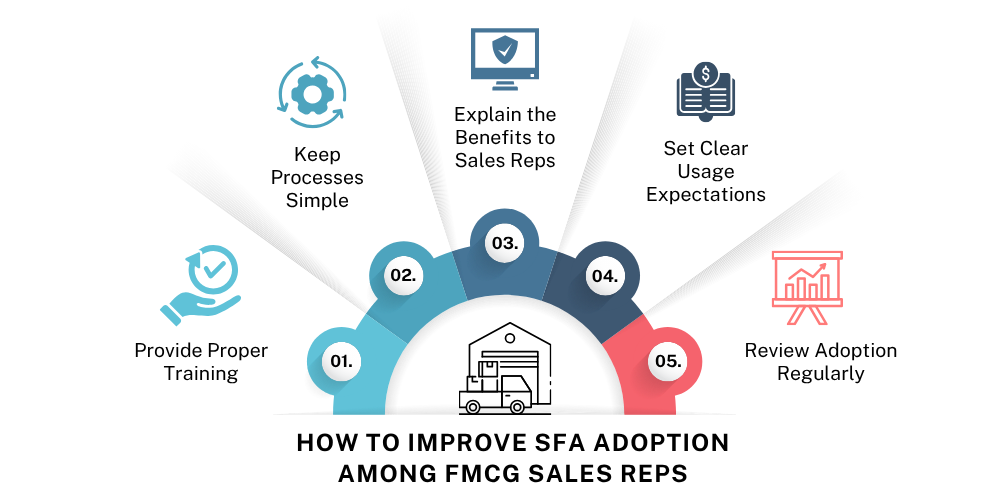
Improving SFA adoption is not simply about asking sales representatives to use the application more often. Adoption improves when the system fits naturally into the existing field-sales process, representatives understand how it helps them, and managers consistently reinforce the expected workflow. The focus should be on removing practical barriers while making digital activities easier and more useful than manual alternatives.
-
Provide Proper Training
Training should walk through the actual sales workflow, not demo every feature the app has. Reps need to know how to get through their regular day, start to finish: checking attendance, reviewing the beat plan, following the route, checking in at retailers, recording visits, capturing orders, updating collections, and completing the EOD report.
Use realistic field scenarios too. What does a rep do when a retailer is closed, an order gets cancelled, a new outlet needs adding, or there's no network? Short refresher sessions help whenever a new feature or workflow gets introduced.
-
Keep Processes Simple
A clunky workflow breeds resistance. If a rep has to enter the same retailer or order information more than once, adoption suffers over time. The SFA process should cut down on repetitive reporting, not add another layer of admin work. The app needs to fit the natural sequence of a field visit. For teams working in rural or low-connectivity areas, offline functionality matters a lot, since reps need to keep recording field activity even without a network and sync once they're back in range.
-
Explain the Benefits to Sales Reps
Adoption goes up when reps actually see what's in it for them, and the pitch shouldn't be all about management visibility and tracking employees. A well-built SFA workflow makes beat plans easier to follow, cuts repetitive reporting, simplifies order booking, puts retailer history within reach, and gets rid of the separate DSR report. That shifts how the app feels, from a monitoring tool to something that genuinely helps them sell. Show reps those benefits during training; don't just hand down instructions from management.
-
Set Clear Usage Expectations
Reps need to know exactly which activities are supposed to go through the SFA platform. An organization can set it out plainly: attendance gets recorded in the app, planned retailer visits get completed and logged, orders get captured digitally, collections get updated, and EOD reports go in before a set cutoff. Clear expectations are what make adoption something you can actually measure. Without a defined standard, one manager calls a rep's usage acceptable, and another calls the same behavior incomplete.
-
Review Adoption Regularly
SFA adoption should become part of normal sales management. A weekly review can identify representatives with declining usage, territories with missing field activity, low order capture, incomplete reports, or poor beat-plan execution. These reviews should be used to understand the reason behind the gap rather than simply rank employees. If one representative has suddenly stopped recording visits, for example, the manager should determine whether the issue is a technical problem, network availability, training gap, workload issue, or process change. This approach makes adoption improvement more practical and sustainable.
How Delta Sales App Helps Monitor Sales Team Activity
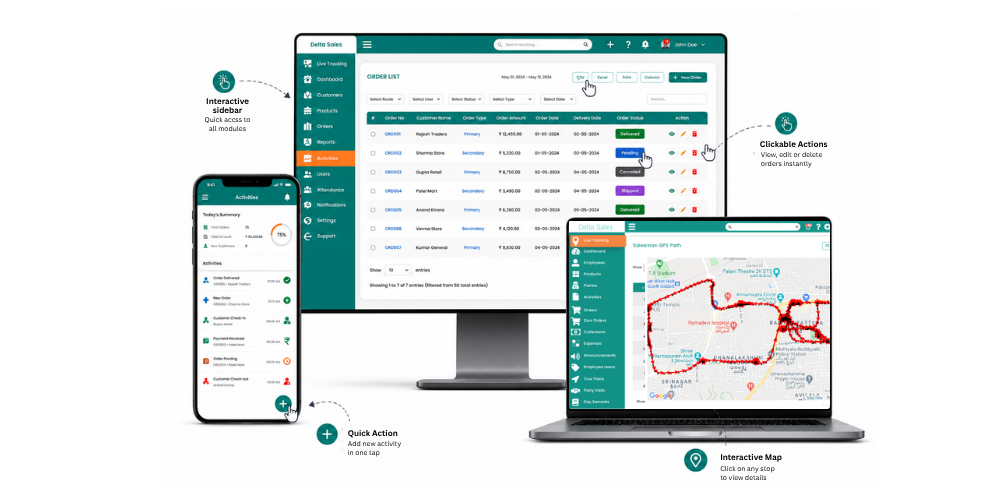
For FMCG organizations, measuring SFA adoption becomes easier when field activities are recorded within the same sales workflow. Delta Sales App brings several field-sales activities into one platform, allowing managers to monitor whether representatives are consistently using the system during their daily work.
-
Track Field Visits and GPS Activity
Delta Sales App uses GPS-based employee location tracking and field activity data to show where reps are moving and which customers they visit. Managers can set that against the planned beats to see how territory coverage and route execution are actually going, which tells them a lot more than simply checking whether someone logged in. It ties app usage to real field activity. For FMCG teams covering large territories, that can surface patterns like outlets that keep getting missed, unusual route deviations, or low activity in specific areas.
-
Monitor Attendance and Check-Ins
Attendance and location check-ins give another easy-to-measure signal of daily app usage. Managers can see whether reps are consistently completing their required attendance and customer check-ins through the platform. Since attendance is just one piece of the workflow, it's worth comparing against visits, orders, and reporting to see whether reps are actually using the app past the start of their day.
-
Capture Orders and Customer Activity
Order booking sits at the center of FMCG field sales, which makes it an important adoption signal. Delta Sales App captures customer activity and orders as part of the normal field-sales process, and managers can view that order activity alongside retailer visits, reps, territories, and other operational data. That gives them a real basis for judging whether the SFA system has actually become the team's regular order-capture channel, instead of a side record kept alongside whatever reps were already doing.
-
Review Daily Sales Activities
Daily field activity can be brought into a structured reporting process instead of relying entirely on manual DSR collection. Managers can review visits, orders, collections, attendance, and other sales activities to understand whether representatives are consistently following the expected workflow. This is particularly useful for identifying gaps between planned field activity and recorded activity.
-
Use Reports and Analytics to Monitor Team Performance
Reports and real-time analytics let managers evaluate adoption at both the individual and team levels. Instead of leaning on one overall adoption percentage, they can compare usage across reps, territories, distributors, and branches. The strongest approach connects adoption metrics to sales execution metrics: does consistent visit recording line up with more productive calls, is order capture holding steady across territories, and are reps actually completing their assigned beats? Looked at that way, SFA adoption becomes an operational KPI, not some isolated technology number sitting off on its own.
Conclusion
Adoption isn't how many reps have the app installed. For an FMCG organization, real adoption shows up in daily field activity. Are reps checking in through the system? Are planned retailer visits getting recorded? Are orders captured digitally? Are DSRs submitted consistently? Are reps actually following their beat plans? Are managers getting data complete enough to understand territory coverage and sales execution?
These questions give a far more accurate picture than login numbers ever will. The most effective approach is to set a baseline, monitor activity regularly, compare usage across reps and territories, and watch how it changes over time. When gaps show up, managers can close them with practical training, simpler processes, clear expectations, and regular reviews.
For FMCG companies trying to bring field visits, attendance, beat execution, orders, collections, reporting, and sales analytics into one connected workflow, Delta Sales App gives the tools to monitor all of this from a central platform. Book a free demo to see how it can support field sales execution and help measure sales-team activity more consistently.

-1792906895-resized320.png)