
Retailer Potential Analysis: How FMCG Brands Identify High-Value Outlets

Not every retail outlet matters equally to an FMCG brand. Two outlets can sit in the same territory, get visits from the same rep, and carry similar categories, and still pull in very different revenue. One does strong repeat business because of heavy footfall, real demand for the category, good product visibility, and a big catchment area around it. The other places small orders despite getting the same attention from the field team.
Current sales alone won't tell you why. An outlet with weak sales today might have plenty of room to grow, and an outlet with strong sales might already be near its ceiling.
That's where retailer potential analysis comes in. Rather than looking only at what an outlet sells now, a brand can estimate what it could realistically sell based on its location, size, customer base, category demand, assortment, competition, and buying habits.
For field sales teams, this analysis can influence everything from beat planning and visit frequency to assortment, trade schemes, retail execution, and territory coverage. In this blog, we will look at how FMCG brands can evaluate retailer potential and turn the findings into practical field-sales actions.
What is Retailer Potential Analysis?
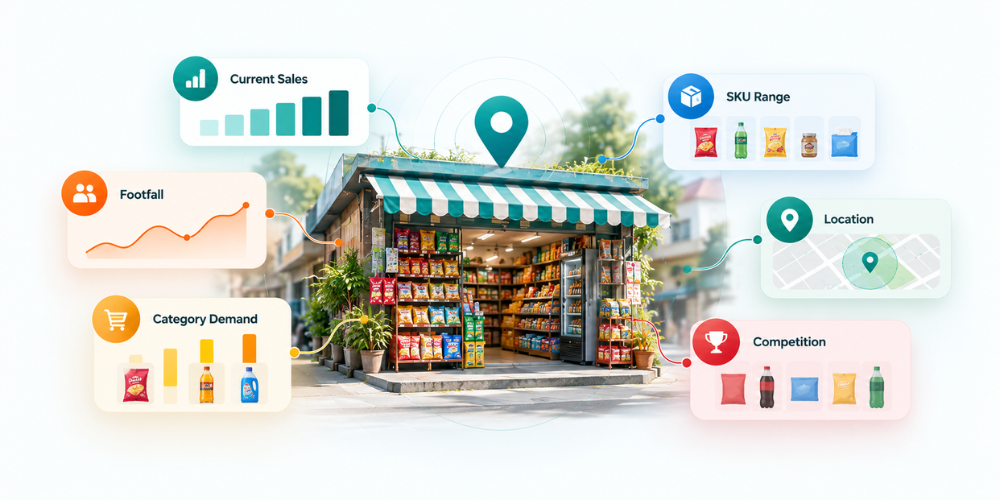
Retailer potential analysis estimates how much business an outlet could generate for an FMCG brand, measured against what it's selling now and what the market around it could support. It pulls together several data points rather than leaning on one number. Sales history matters, but so do the outlet's characteristics, footfall, location, category demand, SKU availability, competitor presence, payment behavior, and catchment area.
A neighborhood supermarket doing NPR 30,000 a month in secondary sales, for instance, might have room for a lot more if several fast-moving SKUs aren't even on its shelves, competitors have the better shelf space, and it sits in a large residential catchment.
The point isn't to sort outlets into "good" and "bad." It's to find out where more distribution, assortment, visibility, sales effort, or trade investment would actually pay off.
Outlet potential vs. current sales
Current sales show how much business an outlet is generating today, while outlet potential indicates how much business it could reasonably generate under the right conditions. For example, Outlet A generates 80,000 in monthly sales against an estimated potential of 90,000, indicating strong current performance with limited room for growth. Outlet B generates 35,000 against a potential of 85,000, suggesting significant untapped opportunity and the need for focused sales efforts.
In contrast, Outlet C generates 15,000 against a potential of 20,000, indicating both low current sales and limited growth potential. This comparison helps sales managers identify which outlets need more attention, where additional sales efforts can deliver better results, and how to prioritize field visits effectively.
If field teams prioritize only current sales, Outlet A will receive the most attention. Retailer potential analysis may identify Outlet B as a critical growth opportunity. This distinction matters because low sales do not automatically mean low value.
How it differs from outlet segmentation
Outlet segmentation sorts retailers by type or business role: supermarkets, convenience stores, traditional trade, wholesale outlets, pharmacies, HoReCa accounts, and so on. Retailer potential analysis goes past that grouping and looks at the actual commercial opportunity sitting inside each one. A convenience store in a high-footfall commercial area may have substantially greater potential than a similar-sized store in a low-demand neighborhood. Segmentation answers, "What type of outlet is this?" Potential analysis asks, how much opportunity does this outlet represent? Both can be used together in an FMCG sales strategy.
Why FMCG brands Need to Measure Retailer Potential
Not every outlet offers the same level of growth opportunity, even when retailers operate in the same territory or sell similar categories. Measuring retailer potential helps FMCG brands understand where additional sales, distribution, and field effort are most likely to come from. It also helps sales managers allocate limited field time and trade resources based on actual outlet opportunity rather than relying only on historical sales.
-
Sales vary widely across outlets in the same territory
A territory's overall sales number can hide big differences between individual outlets. A distributor might serve hundreds or thousands of retailers, but a fairly small group often accounts for most of the secondary sales. Meanwhile, several underdeveloped outlets may already have what it takes to become big contributors. Without outlet-level analysis, field teams usually fall back on historical sales to decide where to spend their time. That causes two problems. High-performing outlets keep getting extra attention even when there's not much more growth left in them. And high-potential outlets with low current orders get overlooked because the order value doesn't flag them as worth the visit. Retailer potential analysis separates what an outlet is doing now from what it could do.
-
Field time and trade spend are limited
A rep can't give every outlet the same amount of attention. A large beat has a fixed number of working hours and a set route, and trade schemes, promotional materials, merchandising resources, and management attention are all limited too. So prioritizing is necessary. High-potential outlets can justify more frequent visits, wider SKU coverage, better merchandising, targeted schemes, or extra execution checks. Lower-potential outlets can run on a lighter service model. The goal isn't to cut service across the board. It's to put field resources where the commercial opportunity actually is.
Data Points That Reveal an Outlet's True Potential
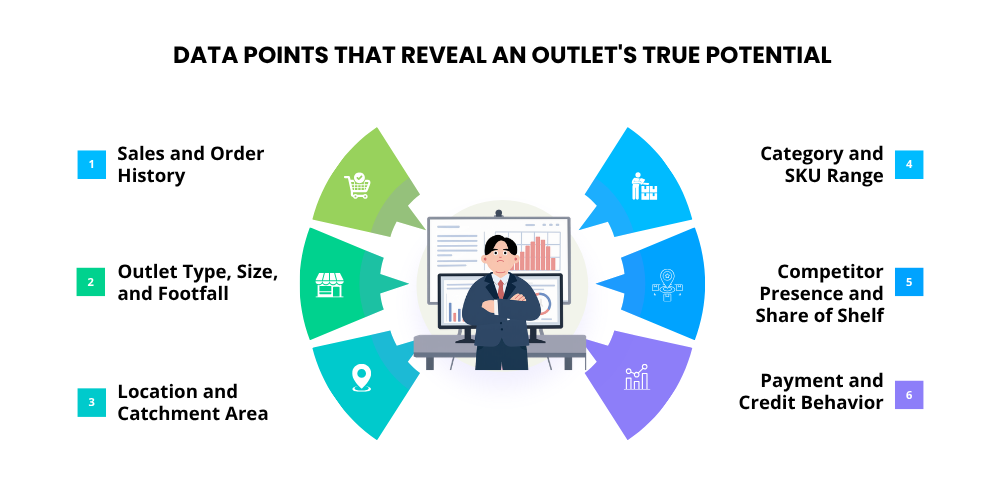
Retailer potential cannot be determined from sales volume alone. A reliable assessment combines sales behavior with information about the outlet, its location, customers, product assortment, competitive environment, and payment patterns. Looking at these data points together helps FMCG sales teams distinguish between outlets that are already performing well and those with significant untapped potential.
Sales and order history
Historical sales are where this starts. The metrics that matter are monthly order value, order frequency, units per order, SKU count, average order value, secondary sales, growth or decline, order consistency, and category-wise sales. The pattern matters as much as the total. An outlet that only places big orders during promotions is a different animal from one placing steady weekly orders. And an outlet with SKU penetration that's climbing may be a better opportunity than one with higher sales that have gone flat.
Outlet type, size, and footfall
Physical characteristics put the sales numbers in context. Outlet-type shapes expected category demand; a large supermarket needs a broader assortment than a small neighborhood store, and a pharmacy buys differently than a general grocery outlet. Store size, estimated foot traffic, number of counters, refrigeration capacity, and operating hours all factor in too. Footfall is especially useful where it's measurable, since a high-traffic outlet can have real sales capacity even when current distribution there is weak.
Location and catchment area
Location can make or break an outlet's potential. The factors are population density, nearby residential areas, commercial activity, schools and offices, transport access, nearby markets, tourist or high-footfall zones, and distance from competing outlets. An outlet serving a large catchment area can deserve more attention than its current order value suggests. Location data gets more useful still when it's paired with GPS outlet mapping and territory mapping, since that lets a sales manager see where high-potential outlets cluster and whether the existing beats actually reach them.
Category and SKU range
Assortment gaps often point to real whitespace. An outlet might only be buying a handful of SKUs despite demand for a much wider range. A retailer selling a brand's beverages, say, might not stock its newer pack sizes, premium variants, or adjacent categories, so the sales figure ends up understating what the outlet could actually sell.
Useful measures: SKU count, category penetration, pack-size coverage, fast-moving SKU availability, new-product adoption, and out-of-stock frequency. SKU-level analysis is more actionable than a total sales number because it points to exactly where the growth would come from.
Competitor presence and share of shelf
Competitive visibility is another signal worth watching. An outlet can have plenty of category demand and still sell little of a given brand because competitors have most of the shelf. Reps can record competitor brands on the shelf, competitor SKU count, shelf space, display position, promotional visibility, price differences, and out-of-stock conditions. That data shows whether weak sales come from low outlet potential or from weak execution.
Payment and credit behavior
Commercial value is not determined by sales volume alone. Payment history can affect the practical value of an outlet to the distributor and brand. Relevant indicators include:
-
Payment timeliness
-
Outstanding balance
-
Credit utilization
-
Collection frequency
-
Order-to-payment pattern
An outlet generating high orders but consistently creating collection issues may require a different commercial approach from a similarly sized outlet with reliable payment behavior.
How to Analyze Retailer Potential Step by Step
A retailer potential analysis works best when it follows a consistent process rather than relying on sales representatives' assumptions or isolated sales figures. FMCG brands can start with a clean outlet database, define the factors that indicate commercial value, score outlets based on potential and current performance, and then translate those scores into practical outlet tiers. The final step is to validate the results with field teams, since on-ground conditions can change faster than the data.
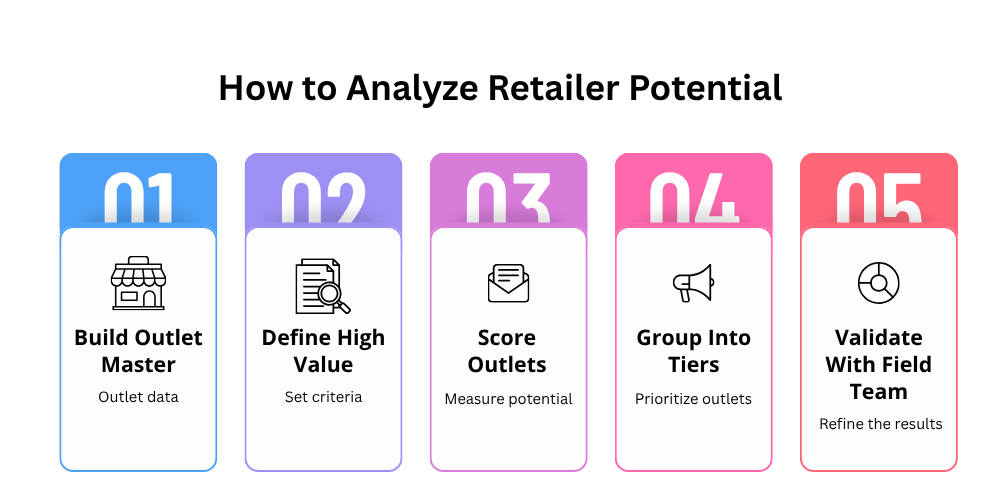
Step 1 – Build a clean outlet master
It starts with reliable outlet data. An outlet master should carry a unique outlet ID, name, location, outlet type, distributor, territory, sales rep, contact information, category, and the relevant commercial attributes. Duplicate outlets, stale addresses, inactive retailers, and inconsistent naming all throw off the analysis.
A field sales management app helps keep the outlet database consistent, since reps can capture and update outlet information during their visits instead of everyone keeping their own spreadsheet.
Step 2 – Define what "high value" means for the brand.
There is no universal definition of a high-value outlet. For one FMCG company, value may mean high monthly sales. For another, it may mean rapid growth potential, premium SKU penetration, strategic location, or strong category demand. The analysis should therefore establish measurable criteria. For example:
-
Current sales
-
Sales growth
-
Order frequency
-
SKU penetration
-
Outlet footfall
-
Category potential
-
Competitive intensity
-
Collection reliability
The criteria should reflect the commercial strategy rather than simply copying another company's scoring model.
Step 3 – Score outlets on potential and current performance
Once the data is available, each outlet can receive a potential score. A basic scoring model might assign weights to factors such as sales, footfall, assortment, location, category demand, and competitor presence. For example:
Retailer Potential Score = Sales Opportunity + Category Opportunity + Outlet Characteristics + Location Opportunity + Execution Opportunity
The exact formula depends on the available data. Separating the potential score from the current performance score is particularly useful. An outlet can then fall into categories such as
-
High potential, high performance
-
High potential, low performance
-
Low potential, high performance
-
Low potential, low performance
The second group deserves particular attention because it can represent the largest untapped growth opportunity.
Step 4 – Group outlets into tiers
The scores can then be converted into operational tiers. A typical structure could include:
-
Tier A: High commercial value and strong growth opportunity
-
Tier B: Moderate value with identifiable growth opportunities
-
Tier C: Lower-value outlets requiring efficient servicing
The tiers should influence field activity. Tier A outlets may require more frequent visits and stronger retail execution. Tier B outlets may receive targeted assortment expansion and focused sales development. Tier C outlets may be managed through efficient route coverage and appropriate order frequency.
Step 5 – Validate the tiers with the field team
Data should drive the analysis, but field experience still counts for a lot. A rep often knows things the system doesn't show. A retailer just expanded. A new supermarket opened down the street. A competitor landed a major display. A previously low-volume outlet now serves a new residential area that's grown up around it. So field feedback should confirm or push back on the initial scoring. The strongest approach uses structured data and field intelligence together, since neither one tells the full story on its own.
Methods FMCG Brands Use to Estimate Outlet Potential
How an FMCG brand estimates retailer potential depends on the size of its outlet network, how good its data is, and how far along it is analytically. Some teams start with simple scoring rules a sales manager can understand at a glance, while others move to whitespace analysis or predictive models to find more specific growth opportunities. The right method is practical enough to guide field decisions today and flexible enough to improve as more outlet-level data comes in.
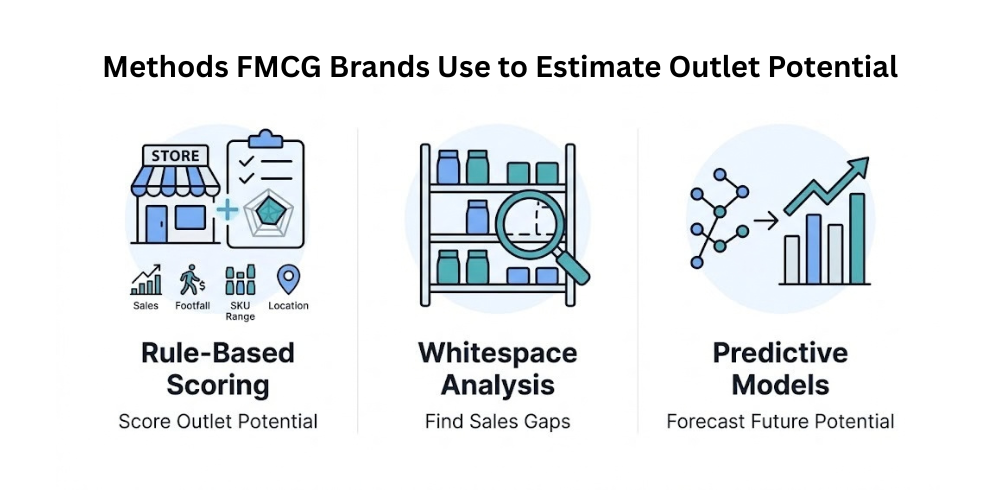
This is created from gemini.. Make same image for this part with same details , content must be same
Rule-based scoring models
Rule-based models are relatively straightforward to implement. Each outlet receives points based on predefined conditions. For example:
-
High footfall: additional points
-
Broad category range: additional points
-
Strong sales growth: additional points
-
Large catchment area: additional points
-
High competitor share: potential opportunity points
The advantage is transparency. Sales managers can understand why an outlet received a particular score. This approach is often practical for FMCG organizations beginning their retailer potential analysis.
Whitespace analysis
Whitespace analysis focuses on what is missing. Instead of asking only what an outlet currently buys, the analysis looks at what the outlet could potentially carry. Examples include:
-
Missing high-volume SKUs
-
Missing categories
-
Low pack-size coverage
-
Weak distribution of new products
-
Limited display presence
-
Competitor-held shelf space
Whitespace analysis is especially useful for identifying incremental secondary sales opportunities.
Predictive models
Companies with enough historical data can run predictive analytics to estimate how an outlet is likely to perform. A model like this might factor in sales history, outlet characteristics, geography, category behavior, seasonality, promotions, and more, and it can estimate expected sales or flag outlets with a high probability of growth. But predictive models need clean data at scale. A weak outlet master and inconsistent field reporting will produce unreliable results no matter how good the model is.

Turning Outlet Potential into Field Actions
Retailer potential analysis becomes useful only when the findings influence what happens in the field. Once outlets are classified by potential, sales managers can adjust visit frequency, assortment, trade promotions, merchandising, and territory coverage accordingly. The goal is to move from simply identifying high-potential outlets to giving field representatives clear priorities for where to spend time and what actions to take during each visit.
-
Set visit frequency by outlet tier
Visit frequency can follow outlet potential. A high-potential outlet deserves more frequent visits, since a lost sale, a stockout, poor execution, or competitor activity there costs more. A lower-potential outlet can get a lighter visit schedule without eating up field time it doesn't need. That gives you a beat plan built on potential, not just whatever visit routine has always been followed.
-
Match schemes and trade promotions to outlet value
Trade promotions should match outlet characteristics too. A high-potential outlet with strong category demand can justify a targeted scheme or display investment. Running the same promotion across every outlet, by contrast, drives up trade spend without a matching return. Potential analysis points sales teams to where a scheme, display, or promotional spend actually makes commercial sense.
-
Plan assortment and distribution for high-potential outlets
Potential analysis can expose gaps in distribution. If a high-potential outlet only carries a fraction of the recommended SKU range, the rep knows to push assortment there. This matters a lot for new product launches: instead of expecting even adoption across every outlet, field teams can focus first on the ones with the right customer profile, footfall, category demand, and buying behavior.
-
Rebuild beats and territories around outlet value
Outlet potential should feed into territory design as well. A beat plan built only around old routes won't reflect where the commercial opportunity sits today. If high-potential outlets have shown up in a different part of the territory, route optimization can fold them in without adding unnecessary travel. GPS-based tracking systems and outlet mapping give managers extra visibility into travel paths, visit frequency, territory coverage, and whether outlets are actually being serviced.
How Field Force Automation Supports Retailer Potential Analysis
Retailer potential analysis is only as useful as the field data behind it. When outlet details, orders, collections, visits, and SKU information are spread across spreadsheets and manual DSRs, it becomes difficult to maintain an accurate picture of outlet performance and opportunity. A field force automation platform can bring these activities into one workflow, giving sales managers more consistent data for evaluating outlets and planning field activity.
-1791090767.png)
For FMCG teams using Delta Sales App, outlet information, sales activity, field visits, and beat planning can be managed through a connected system rather than separate manual processes.
-
Capturing outlet data through a mobile app
A rep can capture and update outlet information right there during the customer visit, including the outlet's location, orders, collections, SKU purchases, visit details, retail execution notes, and photos, depending on the sales process. That keeps the outlet database current for retailer potential analysis. Sales managers work with data captured as part of the regular sales workflow, not an old spreadsheet or a DSR compiled by hand. Delta Sales App handles mobile order management, outlet management, attendance, collection reporting, and field activity tracking. Its offline-first setup also lets reps log sales activity in areas with weak connectivity and sync once they're back online.
-
Tracking outlet performance on live dashboards
Once outlet and sales data is captured consistently, managers need a practical way to read it. Dashboards can show sales by outlet, order frequency, SKU activity, collections, visit coverage, and territory-level performance. For retailer potential analysis, this makes it easier to see the gap between what an outlet is doing and what it could do. An outlet might have strong location potential and regular visits but low SKU penetration, for example, and that combination can point to an assortment or distribution opportunity that territory-level sales alone wouldn't show. Delta Sales App gives real-time sales dashboards and reporting, so managers can follow field activity and outlet performance without waiting for someone to consolidate the end-of-day reports.
-
Prioritizing visits with automated beat planning
Spotting a high-potential outlet is only the first step. The sales team still has to decide when and how often to visit it. Outlet tiers can feed into beat planning, so higher-priority outlets get the field attention they warrant. Route optimization helps reps cover those priority outlets efficiently while cutting unnecessary travel across the territory.
Conclusion
Retailer potential analysis gives FMCG sales teams a fuller view of outlet opportunity. Current sales still matter, but they're not the whole story. Outlet characteristics, location, catchment, category demand, SKU availability, competitive presence, payment behavior, and execution quality can surface opportunities that historical sales figures miss on their own.
The real value shows up when the analysis connects to field execution. High-potential outlets get the visit frequency, assortment attention, trade investment, merchandising support, and route priority they warrant. Lower-potential outlets can be serviced efficiently without eating up field resources they don't need.
A field force automation platform like Delta Sales App supports this by keeping outlet information, orders, collections, field visits, GPS activity, beat plans, retail execution, and sales reporting in one connected workflow. For FMCG brands trying to make territory coverage more deliberate and field activity more data-driven, retailer potential is worth tracking on an ongoing basis, not sorting out once and leaving it alone.
Book a free demo of Delta Sales App to see how a connected field-sales workflow can support outlet management, beat planning, order capture, and real-time sales visibility.
FAQs
1. How is retailer potential different from retailer performance?
Retailer performance measures what an outlet is currently doing, such as sales, order frequency, or SKU purchases. Retailer potential estimates what the outlet could achieve based on factors such as outlet size, footfall, location, category demand, assortment gaps, and competitive conditions. An outlet can therefore have low current performance but high potential.
2. How often should FMCG brands review outlet potential?
A practical review cycle depends on the business and the availability of reliable data. A quarterly review can work for many FMCG organizations, while rapidly changing territories may require more frequent monitoring. Major events such as outlet expansion, territory changes, new product launches, distributor changes, or significant sales shifts should also trigger a review.
3. Which data is needed to start a retailer potential analysis?
The starting dataset can include outlet master information, sales history, order frequency, SKU purchases, outlet type, location, distributor assignment, and visit history. Additional information such as footfall, category demand, competitor presence, shelf space, payment behavior, and catchment characteristics can improve the analysis. The initial model does not need every possible data point. Consistent, reliable core data is more useful than a large dataset filled with gaps.
4. Can small outlets be high-value?
Yes. Physical size alone does not determine commercial potential. A small outlet in a high-footfall location with strong category demand, loyal customers, limited competition, and frequent purchasing can outperform a larger outlet in a weaker catchment. That is why retailer potential analysis should consider multiple variables instead of using store size as the primary indicator.
5. Can Delta Sales App help with retailer potential analysis?
Delta Sales App supports the data collection and field execution involved in retailer potential analysis. Sales teams can manage outlet information, capture orders and collections, track visits and SKU activity, and monitor field performance through dashboards. This data can help sales managers identify outlet-level patterns and prioritize high-potential retailers. Beat planning and route optimization can then help translate those priorities into practical field coverage.