
Why Is Territory-Wise Distribution Analysis Important for FMCG?
A national sales number can look perfectly healthy while several territories are quietly losing distribution, dropping outlet coverage, or carrying the wrong stock entirely. That's one of the biggest blind spots in looking at sales performance only at the aggregate level.
Distribution is rarely uniform across markets. One territory might have strong outlet coverage but low sales per outlet. Another might post high sales off the back of a few large distributors while smaller outlets go underserved. A third might be limited simply because key SKUs are constantly out of stock, or reps aren't covering the planned beat.
That's exactly why territory-wise distribution analysis matters. Instead of treating the business as one big market, FMCG teams can break distribution and sales data down by territory, distributor, outlet type, SKU, sales representative, and other relevant dimensions. That's what shows where distribution is growing, where it's weakening, and why.
For sales managers, the real goal isn't just spotting the best-performing territory. It's understanding why territories perform differently and using that to improve coverage, stock availability, sales routes, distributor performance, and field execution.
This blog covers what territory-wise distribution analysis actually means, why it matters for FMCG brands, which metrics to track, the business decisions it improves, and how field sales software gives the visibility needed to actually act on territory-level data.
What Is Territory-Wise Distribution Analysis?
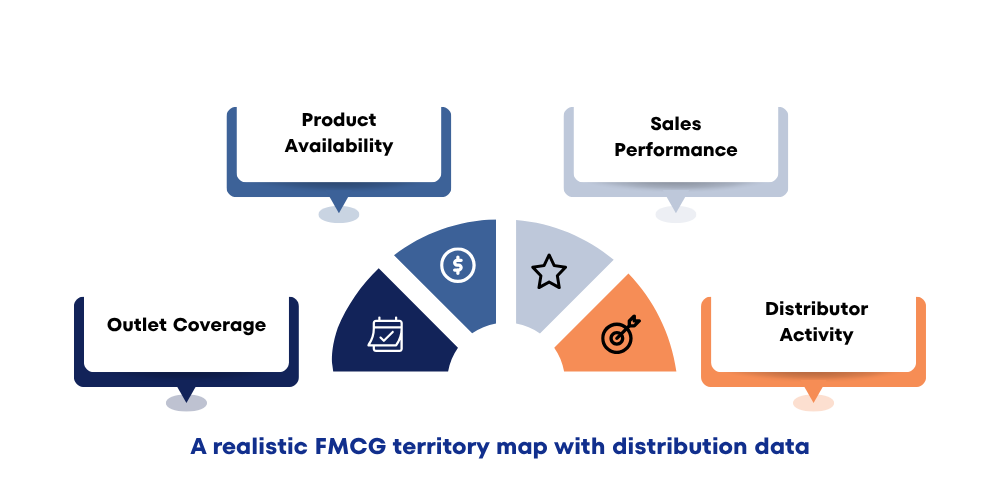
Territory-wise distribution analysis is the process of evaluating a brand's distribution and sales performance separately across different geographic or sales territories. Instead of treating the whole market as one unit, an FMCG company breaks it into smaller territories and examines things like number of outlets covered, active outlets, product availability, sales volume, sales growth, distributor performance, stock availability, order generation, visit frequency, field team activity, and distribution coverage.
The point isn't just comparing territories by sales. It's understanding why performance differs from one market to the next. A territory might have low sales simply because the brand hasn't reached enough outlets there. Another might have solid distribution but weak sales because demand is low or product movement is sluggish. A third might have strong retailer demand but keep running into stock shortages.
That's where sales performance analysis earns its keep. Connect sales with distribution and field execution data, and managers can actually identify what's driving territory-level results instead of guessing.
A territory-wise view also gives business territory-level sales data that actually means something. Instead of just asking how much the company sold overall, managers can see where products are actually selling, where distribution is weak, and which markets have real room to grow.
Why Territory-Wise Distribution Analysis Matters for FMCG Brands
FMCG distribution rarely works the same in every market. Differences in demand, outlet coverage, stock availability, distributor strength, and field execution can create gaps in distribution performance between territories. Territory-wise distribution analysis helps brands spot these differences. It shows where distribution is strong, where gaps in distribution are, and what needs attention.
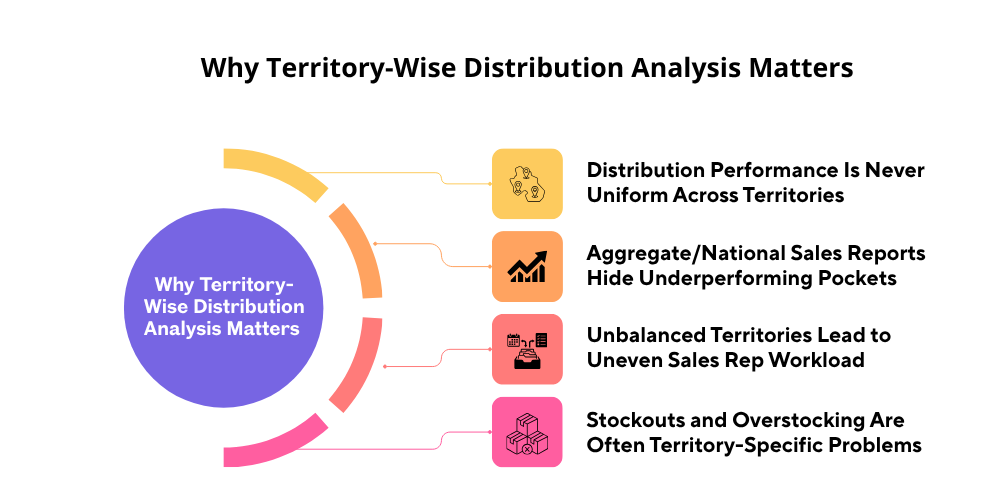
Distribution Performance Is Never Uniform Across Territories
FMCG brands operate across markets with wildly different outlet densities, consumer demand, distributor capabilities, competition, purchasing patterns, and sales potential. A territory with 5,000 retail outlets can't be managed the same way as one with 1,000. Even two territories with similar outlet counts might need different strategies, since their product mix, purchasing frequency, and market potential rarely line up exactly.
Territory A might have high outlet coverage but relatively weak sales per outlet. Territory B might have fewer covered outlets but far stronger sales productivity. Evaluating both purely on total sales and the underlying distribution story stays hidden completely. Territory-wise distribution analysis separates those variables: outlet coverage, sales per outlet, SKU distribution, distributor performance, and field activity within each territory. That's what gives a genuinely practical view of whether distribution is actually expanding or whether sales are coming from a small, limited group of outlets carrying the whole territory.
Aggregate/National Sales Reports Hide Underperforming Pockets
National or regional sales reports are useful for understanding overall business performance, but they can hide real problems sitting inside individual territories. Say a brand reports 12% overall sales growth. That sounds great on the surface. But the number might come almost entirely from a few high-performing urban markets while several smaller territories are actually declining. Without territory-level analysis, managers won't immediately catch things like
-
diminishing presence in stores
-
infrequent ordering patterns
-
weak secondary sales
-
lackluster follow-up sales from distributors
-
product shortages at the SKU level
-
unfulfilled sales appointments
-
ineffective in-store execution
This is exactly why aggregate sales shouldn't be the only performance indicator a business relies on. A territory contributing less revenue today can still have real growth potential if outlet coverage is low and there's plenty of room left to expand distribution. Meanwhile, a high-revenue territory might actually need attention if growth is slowing or distribution is quietly concentrating into fewer and fewer outlets. Breaking the data down by territory is what makes both of those patterns visible in the first place.
Unbalanced Territories Lead to Uneven Sales Rep Workload
Territory performance also ties directly into field-force workload. A rep covering a dense urban territory might have hundreds of potential outlets packed into a small geographic area. Another rep might cover a much larger area with fewer outlets but way more travel time eating into the day. Without proper territory analysis, that workload gets uneven fast: one rep struggles to complete the assigned beat plan while another sits with capacity going unused. That imbalance ends up affecting outlet coverage, visit frequency, order collection, and field productivity across the board.
Territory-wise distribution analysis lets sales managers compare the number of assigned outlets, planned visits, actual visits, orders generated, travel requirements, sales per representative, and territory sales potential, all side by side. That's what supports real territory allocation and beat planning that's actually grounded in reality instead of an assumption from a year ago.
Stockouts and Overstocking Are Often Territory-Specific Problems
Inventory problems do not always affect the business. One SKU can be out of stock in one region while another region has much distributor stock. If we only look at inventory for the company, we might miss this mismatch. For instance, a brand might have inventory across the country, but that does not guarantee that each distributor or retailer has the right SKU at the right time. A selling SKU might run out in one market while it sits unused in another. Analyzing distribution by territory reveals these gaps. By merging territory sales, distributor stock, order data, and SKU availability, teams can find where replenishment is needed and where inventory must be handled carefully. This is crucial when demand rises in seasons, when new products launch, during promotions, and whenever consumer demand shifts.
Key Metrics for Territory-Wise Distribution Analysis
A useful territory analysis should go beyond total sales. FMCG teams need a combination of distribution, coverage, sales, and stock metrics.
Numeric and Weighted Distribution
Numeric distribution tells you what percent of the outlets that matter are carrying a product. Numeric distribution shows this percentage in a way. For example, a brand that aims for 1,000 outlets and finds its product in 600 of them has a distribution of 60 percent. Numeric distribution is easy to calculate and easy to understand. Weighted distribution adds another layer. Weighted distribution takes into account how important each outlet is to sales. Weighted distribution lets you see which outlets matter most. When you combine distribution and weighted distribution, you gain a clearer picture of how far the product reaches and how good that reach is. These two measures together give you a view of distribution. A territory might have outlets that carry the product, but if those outlets sell little, the territory still adds little to sales. Another territory might have outlets, yet if those outlets are high‑volume, the territory can drive much stronger sales. Distribution quality can make a difference. Comparing distribution and weighted distribution gives managers a fuller view of distribution coverage. This comparison helps managers decide where to focus next.
Outlet Coverage and Visit Strike Rate
Outlet coverage provides insight into whether the field team is effectively reaching the intended retail landscape. A straightforward way to measure this is by comparing the number of outlets actually visited to those that were planned for coverage.
The formula for outlet coverage is
Outlet Coverage = (Outlets Visited ÷ Planned Outlets) × 100.
Additionally, the visit strike rate helps assess how many of the visited outlets resulted in an order. It's possible for a territory to have good visit coverage but a low strike rate, which may signal issues such as stock shortages, low product demand, pricing concerns, ineffective sales execution, or misaligned outlet targeting. By analyzing these metrics together, managers can gain a clearer picture of field performance and identify areas for improvement.
Sales and Growth Per Territory
Sales value and volume are still important. The trend is usually more helpful than just one number. Teams can compare:
-
sales with the previous period
-
Current sales with the same period from last year
-
Sales growth in each territory
-
Sales per outlet
-
Sales per representative
-
Sales growth for each SKU
-
Primary sales versus secondary sales
This makes it easier to find territories that are growing, shrinking, or staying the same. It also stops managers from using the approach for every territory. A territory that is old and has sales but little growth might need a different plan than a new territory that has lower sales now but a lot of potential to grow.

Stock Availability and Fill Rate
Stock availability measures whether the products customers and retailers need are actually available. For territory-level analysis, teams can track stock availability by:
-
Territory
-
Distributor
-
Outlet
-
SKU
-
Promotion
-
Sales period
Fill rate can also help measure how effectively orders are being fulfilled. A territory with good outlet coverage but poor stock availability has a distribution problem that cannot be solved simply by adding more sales visits.
The data needs to show whether the issue is distributor inventory, replenishment, order fulfillment, forecasting, or field execution.
Business Decisions That Territory-Wise Analysis Improves
Territory‑wise analysis is valuable not for reporting performance but also for making better day‑to‑day and strategic business decisions. When I look at analysis, I see that comparing sales, coverage, stock availability, and market conditions across areas helps FMCG brands spot places where resources need to be moved and where new growth chances appear.
-
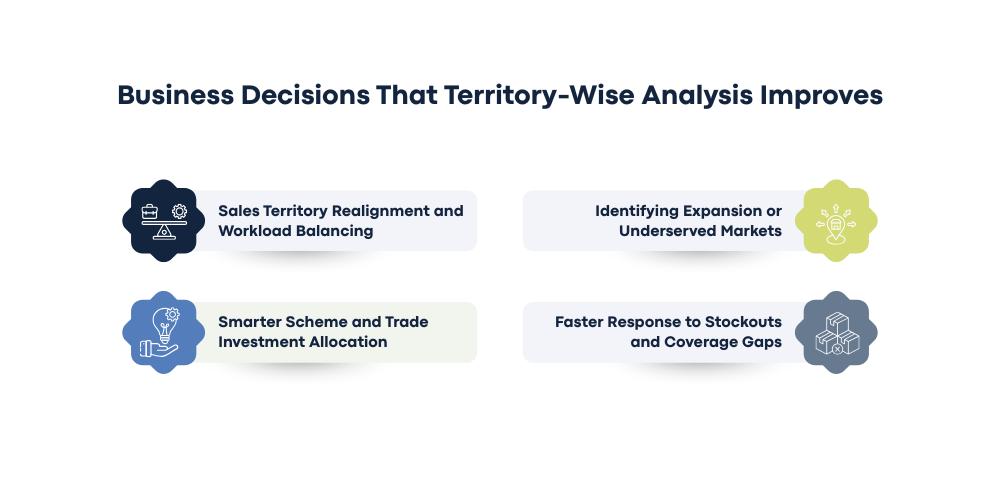
Sales Territory Realignment and Workload Balancing
Territories should reflect both market opportunity and field-force capacity. If one representative has too many outlets while another has relatively few, coverage quality can suffer. Territory analysis can reveal these workload differences through outlet counts, visit frequency, travel patterns, order activity, and sales productivity. Managers can then adjust territories or redistribute outlets where necessary. This also creates a stronger foundation for beat plan optimization. Rather than creating routes only around geographic proximity, teams can consider outlet potential, visit frequency, sales contribution, and distribution priorities. The result is a territory structure that is easier to execute and measure.
-
Identifying Expansion or Underserved Markets
Not every area with sales is a weak market. Sometimes the low sales happen because the product is not available in places instead of because people don't want it. For example, if an area has stores that could sell the product, but only a few of them actually carry the brand, there could be a lot of opportunity to grow. Managers can look at the number of stores, how many are currently selling the product, how much is sold, the variety of products available, the ability of the distributors, and how often orders are placed to find markets that are not being served well. This leads to a way to grow the business. Instead of looking only where sales are already high, the team can also look at where the brand has the biggest difference between what it could sell and what it is actually selling.
-
Smarter Scheme and Trade Investment Allocation
Promotional schemes, retailer incentives, discounts, displays, and other trade investments do not need to be spread out across all territories. A territory that already has distribution but is seeing sales drop may need a different kind of support compared to a territory where the main issue is having too few outlets. Looking at each territory separately helps teams see where trade investments are actually working. Managers can look at sales increases, how many outlets are carrying the product, how fast SKUs are moving, whether stock is available, and how well the plans are being carried out. By comparing these details across territories, they can see which efforts are really driving distribution growth. This allows for budgeting, where promotional spending is based on real market conditions instead of guessing or assumptions.
-
Faster Response to Stockouts and Coverage Gaps
A territory-level dashboard helps make operational gaps easier to spot. When a key SKU begins to show availability in a specific distributor area, managers can look into it early. This allows them to act before the problem spreads to outlets. Similarly, if a sales team keeps missing planned outlets, managers can see the coverage gap. Check the beat plan for that area. This reduces the time between discovering an issue and taking action. For FMCG companies, with field teams and extensive distributor networks, faster response times can really affect retail availability and keep sales going smoothly.
How Technology Enables Territory-Wise Distribution Analysis
Technology can make territory analysis more practical by connecting field activity, outlet information, distributor data, and sales performance.
A territory management app can help managers organize sales territories, monitor field activity, and compare performance using current operational information rather than relying entirely on delayed reports.
Real-Time Reports and Dashboards
Real-time dashboards allow managers to review territory performance without waiting for reports to be consolidated. Real-time dashboards let managers compare sales, visit orders, outlet coverage, and other field activities across markets. For example, if sales suddenly decline in one territory, managers can check whether the change is connected to outlet coverage, reduced orders, stock availability, or field activity. Real-time dashboards give managers field sales visibility and make daily distribution decisions more data-driven.
GPS-Based Location Tracking for Coverage Verification
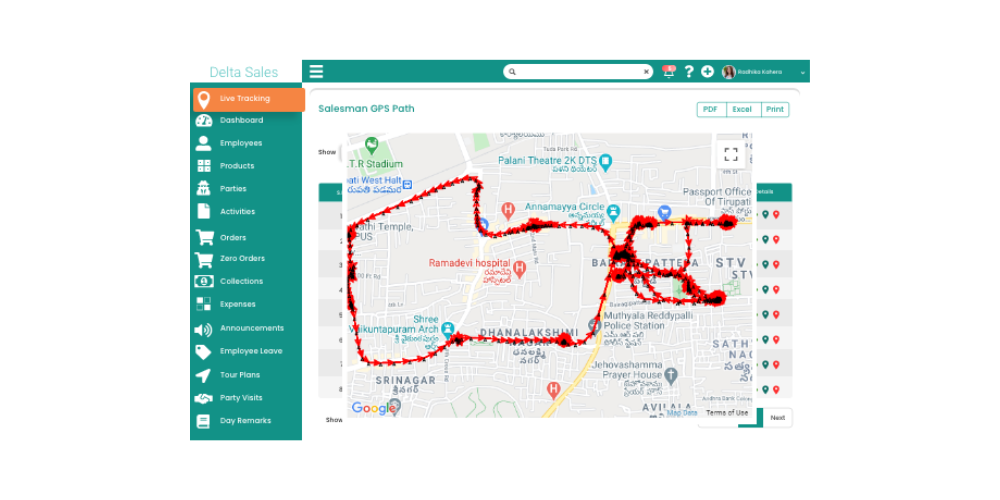
GPS-based location tracking can add information about how well a territory is performing. Managers can check if representatives are going to the places they are supposed to and find out where the work is really happening. When GPS data about visits is mixed with information about stores and sales, companies can see the difference between what was planned and what actually happened in the field. This makes it easier to tell the problems in the market from the issues caused by not visiting stores or not doing the work properly.
Beat Plans Tied to Territory Performance Data
You may notice that beat planning tells you which outlets representatives should visit and how often they should be covered. Beat planning also helps managers see if the current coverage matches the business priorities when it is tied to territory performance. For example, if a territory has sales potential but low outlet coverage, you might need a new beat plan or to increase visit frequency. This creates a link between territory planning, field execution, and distribution results.
Distributor-Level Visibility Across Territories
Distributors play a major role in FMCG distribution. Territory-wise analysis becomes more useful when managers can also understand distributor performance. Companies can compare distributors based on:
-
Product availability
-
Order movement
-
Retailer coverage
-
Sales contribution
-
Stock position
-
Territory reach
This gives managers a more complete view of the distribution network and helps determine whether a territory-level problem is related to distributor operations, field execution, or market demand.
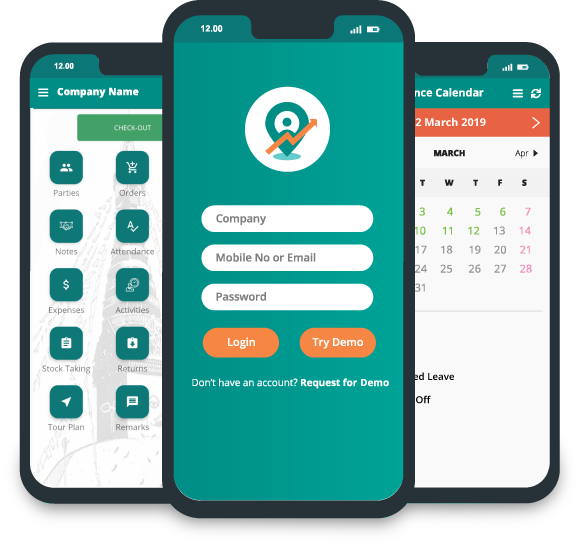
For FMCG companies managing multiple territories and distributors, a territory management system like Delta Sales App can bring these operational insights into one system and make territory-level decision-making easier.
Conclusion
FMCG distribution issues are not the same in every market. A certain area might have trouble reaching stores while another has problems with the stock that distributors hold. A third area could have much work for the sales team. Looking at all of these as a national sales issue makes it harder to find the right solution. Analyzing distribution on a territory-by-territory basis gives the needed level of detail.
By using numbers and weighted methods, outlet coverage, sales growth, stock availability, fill rate, field activities, and how distributors are doing, FMCG brands can see not only where things are changing but also the reasons behind it. The next step is taking that information. Doing something with it. Better ways to assign areas, choose where to grow, create plans for each area, improve stock availability, and focus on better trade investments all become simpler when managers have clear data at the territory level. For FMCG teams that handle field teams and distributor networks, Delta Sales App can bring together territory activities, visits to stores, order tracking from the field, plans for each area, details about distributors, and sales reports into one single system.
If your team is still relying on fragmented field reports to understand territory performance, it may be time to bring that data into a more structured workflow. Book a free demo of the Delta Sales App and see how your sales team can improve territory visibility and field execution.