Key Distribution KPIs Every Sales Leader Should Track

In today’s fast-moving consumer goods (FMCG) and distribution-driven businesses, sales success is no longer just about how much you sell, it's about how efficiently you distribute, execute, and monitor performance on the ground.
With the rise of Sales Force Automation (SFA) and mobile field sales tools, sales leaders now have access to granular, real-time data from distributors, warehouses, and field teams. However, data alone doesn’t drive growth. The right Distribution KPIs do.
This blog breaks down the most important distribution KPIs every sales leader should track, explained in simple language and grouped logically so you can turn numbers into clear actions.
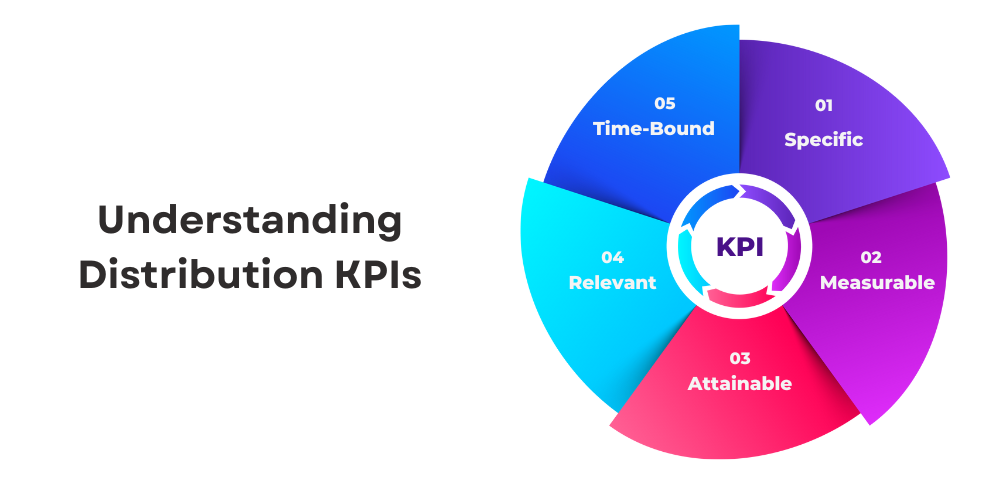
Understanding Distribution KPIs
Distribution KPIs (Key Performance Indicators) are measurable values that show how well your distribution network is performing. These KPIs help sales leaders answer critical questions such as:
-
Are our products reaching the right outlets?
-
Are sales reps visiting the right stores at the right frequency?
-
Are distributors managing inventory efficiently?
-
Are we losing sales due to stockouts or poor shelf visibility?
By tracking the right KPIs, organizations can identify inefficiencies early, improve route planning, enhance product availability, and strengthen customer satisfaction.
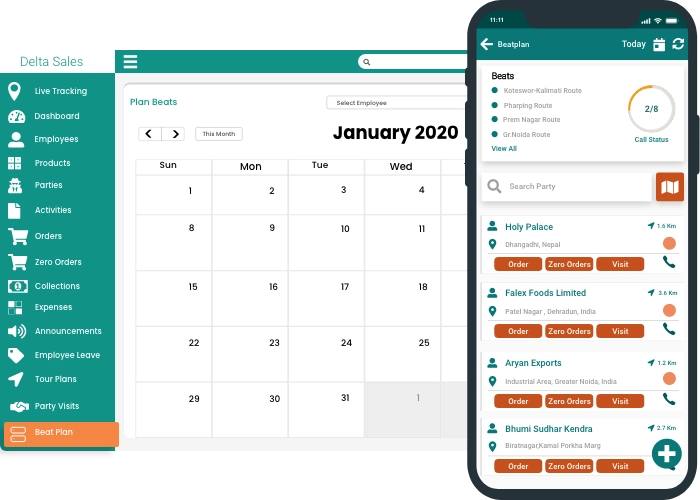
Modern platforms like the Delta Sales App make it easier to capture these metrics automatically from field activities, orders, and inventory movements reducing dependency on manual reporting and guesswork.
Why Sales Leaders Must Track Distribution KPIs
Sales leaders oversee complex ecosystems involving field reps, distributors, retailers, and warehouses. Without KPIs, decision-making becomes reactive rather than strategic.
Tracking distribution KPIs helps you:
-
Improve field force productivity: Distribution KPIs reveal how effectively sales reps use their time, helping managers optimize routes, increase productive visits, and eliminate inefficiencies in daily field activities.
-
Increase numeric and weighted distribution: Tracking distribution coverage kpis helps identify missing outlets and low-availability areas, enabling teams to expand product presence across more stores and high-potential retail locations.
-
Reduce stockouts and expiry losses: Inventory and replenishment KPIs highlight demand gaps early, helping prevent stockouts, reduce expired inventory, and ensure the right products are available at the right time.
-
Optimize distributor performance: Distributor KPIs measure order fulfillment, inventory health, and sales contribution, allowing sales leaders to identify underperforming partners and take corrective, data-driven actions.
-
Improve execution at retail outlets: Retail execution KPIs track visit quality, shelf availability, merchandising compliance, and asset usage, ensuring consistent in-store execution and stronger brand visibility across outlets.
When aligned with tools like field sales tracking software, KPIs become actionable insights rather than static reports.
Field Force Activity in sales KPIs
The field team is the backbone of your distribution engine. These KPIs measure how effectively your sales reps and merchandisers operate on the ground.
1. Daily Visits per Sales Representative
This KPI shows how many outlets a sales rep visits in a day.
Formula: Total visits ÷ Working days
Low numbers may indicate poor route planning or time wastage. Using a route planning and sales tracking system, sales leaders can improve daily coverage without increasing headcount.
2. Client Coverage Percentage
This measures how many active outlets are actually being visited.
Formula: Visited outlets ÷ Total outlets in portfolio
Consistent low coverage often leads to lost visibility and declining shelf presence issues that can be identified early through outlet-level reporting in the Delta Sales App.
3. Visit Frequency
Visit frequency tracks how often each outlet is visited over a given period.
Different outlet types (A/B/C) require different visit frequencies to maintain optimal distribution and availability.
4. Route Compliance (Route Adherence)
Route compliance measures how closely reps follow their assigned beat plans.
Formula: Outlets visited on route ÷ Total outlets on route
Low compliance may signal poor route design, lack of monitoring, or execution gaps. GPS-enabled check-ins and map-based routes help sales managers address this proactively.
5. Time-Based KPIs
These KPIs focus on productivity:
-
Average working start and end time
-
Average time spent per store
-
Total in-store duration
-
Transport duration between visits
With real-time field force monitoring, managers can identify inefficiencies such as excessive travel time or underutilized working hours
6. Strike Rate
Strike rate measures the percentage of visits that result in an order.
A declining strike rate often indicates pricing issues, poor assortment, or low retailer engagement. Sales leaders using order capture and analytics tools can quickly pinpoint underperforming territories or SKUs.
7. Sales Value per Sales Representative
This KPI shows how much revenue each rep generates per day. It helps compare performance across territories while adjusting for route size and outlet density.
8. Drop Size
Drop size indicates the average value per order.
Formula: Total sales ÷ Number of orders
Increasing drop size through better assortment visibility and cross-selling is often more cost-effective than increasing outlet coverage.
9. Lines per Productive Call
This measures how many products are sold in each successful visit. Higher values indicate better selling skills and stronger assortment penetration.
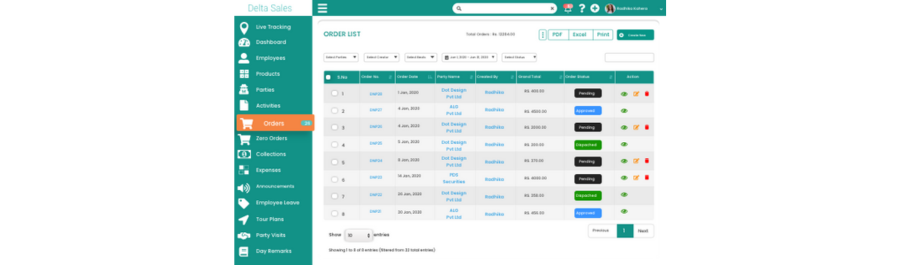
10. Order Fulfillment Rate
This KPI measures the percentage of orders delivered:
-
On time
-
In full
-
To the correct location
A low fulfillment rate directly impacts retailer trust and future orders. Monitoring this through distributor management dashboards helps sales leaders intervene early.
11. Frequency of Purchase
This KPI tracks how often retailers place orders. Declining frequency can signal stock availability issues, competitor pressure, or weak rep engagement.
12. Inventory Accuracy
This measures how closely system stock matches physical stock. Poor inventory accuracy leads to stockouts, overstocking, and lost sales. Using an integrated inventory management module helps ensure real-time visibility across distributors and warehouses.
13. Stock Health KPIs
Important metrics include:
-
Stock levels by distributor or warehouse
-
Percentage of stock near expiry (critical for perishable goods)
-
Damaged or returned stock percentage
These KPIs allow sales leaders to rebalance inventory proactively and reduce write-offs.
14. On-Shelf Availability (OSA)
OSA measures how many planned SKUs are actually available on the shelf. Low OSA often points to replenishment or execution gaps rather than demand issues. Merchandising audits captured via mobile apps provide accurate OSA insights at store level.
15. Out-of-Stock (OOS) Rate
OOS represents lost sales opportunities. Tracking OOS by SKU, store, and region helps prioritize corrective actions.
16. Share of Shelf (SoS)
SoS measures how much shelf space your brand occupies compared to competitors within a category. Higher SoS usually translates to better visibility and higher sales velocity.
17. POSM Availability & Quality
It tracks the percentage of shops with POSM installed and also the condition of POSM (new, fair, poor). Digital surveys simplify POSM audits and ensure consistent brand execution.
18. Sales Asset Utilization
For assets like fridges, kiosks, or display units:
-
Number of assets present
-
Utilization rate (sales per asset)
-
Asset condition
These KPIs help justify asset investments and identify underperforming locations.
Best Practices for Using Distribution KPIs Effectively
Tracking KPIs alone is not enough. Sales leaders should:
-
Focus on a manageable set of KPIs: Tracking too many KPIs creates confusion. Focus on a few high-impact metrics that directly influence sales performance, distribution efficiency, and decision-making.
-
Align everyone on clear KPI definitions: Ensure all teams interpret KPIs the same way. Clear definitions prevent misunderstandings, ensure consistent reporting, and help teams work toward common performance goals.
-
Review KPIs at multiple levels: Analyze KPIs at national, regional, distributor, and sales-rep levels to identify performance gaps, compare trends, and take targeted corrective actions.
-
Share insights regularly via dashboards and mobile access: Regularly sharing KPI insights through dashboards and mobile apps keeps teams informed, improves accountability, and enables faster, data-driven decisions.
-
Link KPIs directly to action plans: KPIs should drive action. Connect performance metrics to specific improvement steps, responsibilities, and timelines to ensure measurable business impact.
Solutions like the Delta Sales App allow teams to visualize KPIs in real time, enabling faster decisions and better accountability.

Conclusion
Distribution excellence is built on visibility, discipline, and data-driven execution. With tools like Delta Sales App, sales leaders gain real-time visibility into field activities, distributor performance, inventory, and retail execution without relying on assumptions or delayed reports.
By consistently tracking and acting on the right distribution KPIs using Delta Sales App, organizations can:
-
Reduce operational inefficiencies
-
Improve on-shelf availability and shelf presence
-
Strengthen distributor accountability and relationships
-
Drive sustainable and predictable sales growth
In an increasingly competitive market, sales leaders who combine strong KPI discipline with the power of this App will always stay one step ahead.
Ready to take control of your distribution performance? Explore Delta Sales App Today and turn your field data into measurable growth.
-1785645604-resized320.png)
-1785498898-resized320.png)