
Which Sales Reports Should FMCG Managers Review Daily?

For FMCG businesses, sales performance can change quickly. A strong sales day can be followed by missed targets, declining orders, poor outlet coverage, stock shortages, or delayed collections. Because field teams, distributors, retailers, products, and territories are constantly moving, managers need more than a monthly sales summary to understand what is happening in the market.
Daily sales reports give FMCG managers a clearer view of current performance and help them identify problems before they become larger revenue gaps. With effective automated reports and analytics, managers can compare targets with actual sales, monitor field activities, identify underperforming territories, and understand which products and outlets are driving results.
However, reviewing every available report every day is neither practical nor necessary. Managers should focus on reports that directly support daily decisions.
Here are the key sales reports FMCG managers should review regularly.
Why Should FMCG Managers Review Sales Reports Daily?
FMCG sales operations involve a large number of transactions across retailers, distributors, sales representatives, territories, and product categories. Waiting until the end of the week or month can make it difficult to identify where performance started declining.
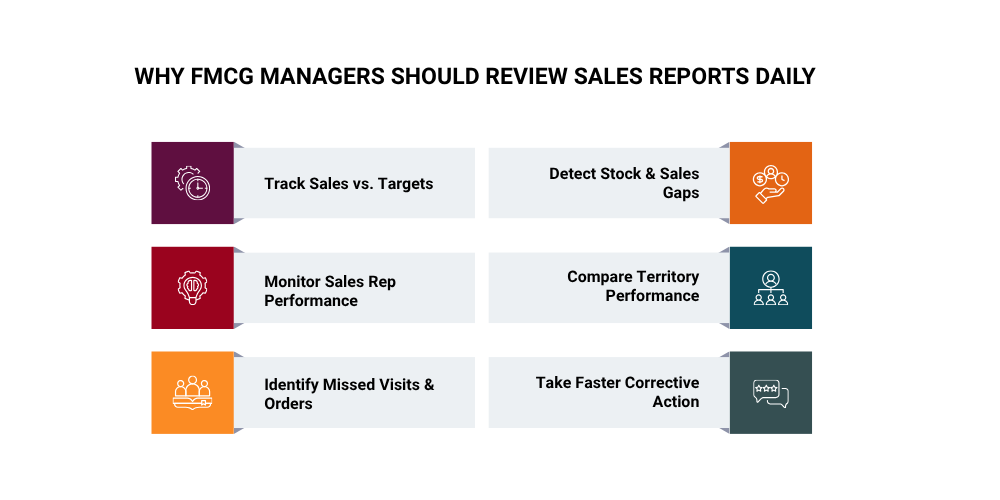
Daily reporting allows managers to answer questions such as:
-
Did the team achieve yesterday's sales target?
-
Which representatives performed above or below expectations?
-
Were planned outlets actually visited?
-
How many visits generated orders?
-
Which products are selling faster or slower?
-
Which territories are missing their targets?
-
Are distributors processing retailer orders properly?
-
Are stock shortages affecting sales?
-
Are outstanding payments increasing?
A well-designed sales performance dashboard brings these indicators together so managers do not have to manually compare multiple spreadsheets.
Daily sales analytics can also reveal patterns that may not be obvious from total revenue alone. For example, overall sales might remain stable while one territory experiences a significant decline. Similarly, a representative may complete many visits but generate very few orders.
The purpose of daily reporting is therefore not simply to monitor employees. It is to understand what is happening in the market and where management action is required.
What Should a Daily FMCG Sales Report Tell Managers?
A useful daily sales report should provide more than a single sales number. It should connect sales results with the activities and operational factors behind them.
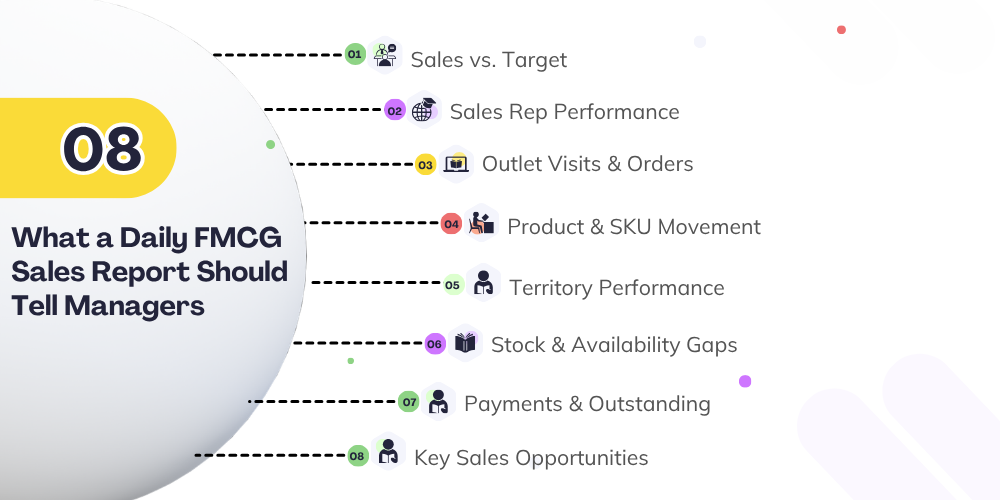
At minimum, managers should be able to see:
-
Sales achieved versus target
-
Sales by representative
-
Outlet visits and productive calls
-
Orders booked
-
Average order value
-
Product and SKU movement
-
Territory performance
-
Primary and secondary sales
-
Distributor activity
-
Stock availability
-
Payment collections
-
Outstanding amounts
This creates a complete view of sales execution.
For example, if sales are below target, the manager should be able to determine whether the problem is caused by fewer outlet visits, low order conversion, poor product availability, weak territory performance, or another operational issue.
This is where sales tracking becomes valuable. Instead of treating revenue as an isolated metric, managers can connect sales results with field activities and distribution performance.
Daily Sales and Target Achievement Report
The first report an FMCG manager should review is the daily sales and target achievement report.
This report compares actual sales against the assigned target for the day, territory, representative, distributor, product category, or business unit.
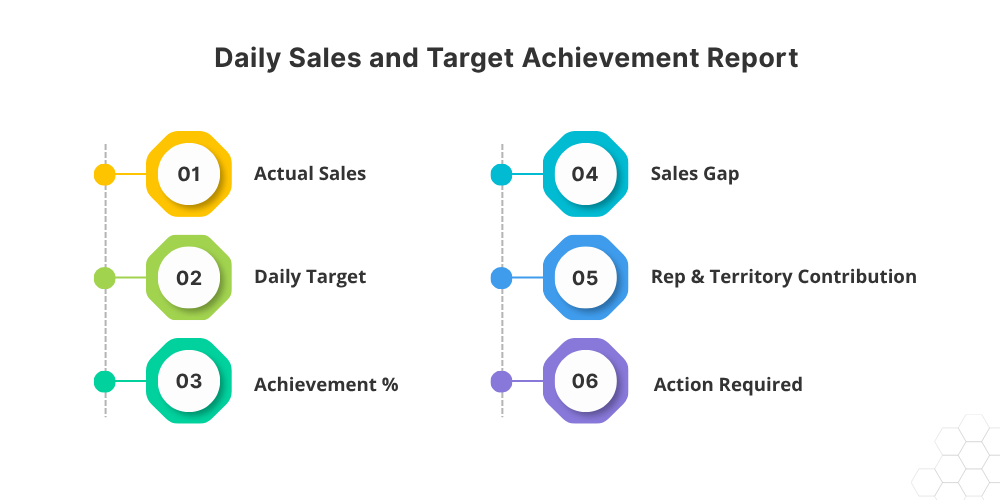
Managers can monitor:
-
Daily sales value
-
Target achievement percentage
-
Sales variance
-
Territory-wise achievement
-
Representative-wise achievement
-
Product category contribution
-
Month-to-date performance
For example, if a territory has achieved only 70% of its expected sales, the manager can investigate the reason rather than waiting until the end of the month.
Daily sales target tracking also helps managers identify whether the team is consistently behind target or whether a single poor day caused the gap.
The important point is to look beyond total revenue. A business may achieve its daily target because of one large distributor order while retail sales remain weak. Managers should therefore compare target achievement with other reports before deciding that performance is healthy.
Sales Representative Performance Report
FMCG field teams often manage hundreds or thousands of retail outlets. A sales representative performance report helps managers understand how individual representatives are contributing to overall sales.
-1789882692.png)
The report can include:
-
Sales achieved
-
Assigned target
-
Number of outlets visited
-
Productive visits
-
Orders generated
-
Average order value
-
New outlets added
-
Collection activity
-
Working days or field activity
This helps managers evaluate sales rep productivity more accurately.
For example, Representative A may visit 30 outlets and generate 20 orders, while Representative B visits 40 outlets but generates only 10 orders. Looking only at the number of visits would make Representative B appear more active. Looking at productive visits and sales provides a more useful picture.
Managers can use these insights to identify coaching requirements, territory challenges, workload imbalances, or best practices that can be shared across the team.
Outlet Coverage and Productive Visit Report
Outlet coverage is one of the most important indicators for FMCG field sales teams.
An outlet coverage report shows whether representatives are visiting the outlets assigned to them and whether those visits are generating meaningful business activity.
Managers should distinguish between:
Planned visits: Outlets scheduled for the day.
Completed visits: Outlets actually visited.
Productive visits: Visits that resulted in an order or another defined sales outcome.
This distinction is important because high visit numbers do not necessarily mean strong sales execution.
A representative might complete 25 visits but generate only five orders. Another may complete 18 visits and generate 15 orders. The second representative may be achieving better commercial productivity.
Tracking outlet coverage helps managers identify missed outlets, weak territories, low visit productivity, and potential distribution gaps.
Order Booking and Average Order Value Report
Order data provides an important connection between field activity and revenue.
An FMCG manager should review how many orders were booked each day, their total value, and the average value per order.
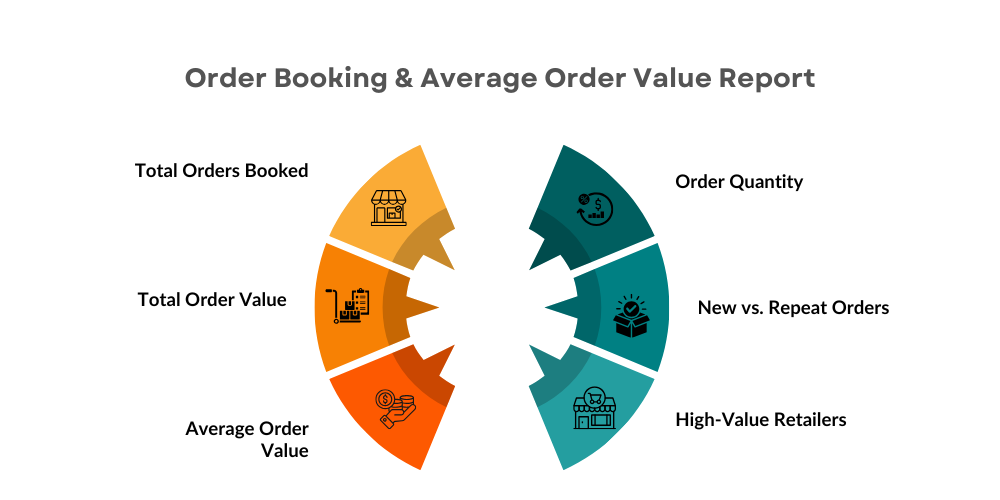
Strong order management helps managers understand whether field activity is converting into actual demand.
For instance, if outlet visits are increasing but order value is declining, the issue may not be sales coverage. It could be reduced retailer demand, product availability, pricing, or ineffective product assortment.
Average order value is particularly useful because increasing the number of orders does not always produce proportional revenue growth. Managers can investigate opportunities for better product mix, cross-selling, or larger retailer orders.
Product and SKU Performance Report
FMCG businesses often manage hundreds or thousands of SKUs. Total sales alone cannot show which products are contributing to growth.
A product and SKU performance report helps managers identify:
-
Fast-moving products
-
Slow-moving products
-
Declining SKUs
-
High-value products
-
Product category performance
-
Quantity sold
-
Revenue contribution
-
Territory-wise SKU movement
This information can support decisions related to inventory, promotions, distribution, and sales priorities.
For example, if a particular SKU is selling strongly in one territory but poorly in another, managers can investigate whether the difference is caused by distribution reach, retailer demand, pricing, competitor activity, or stock availability.
SKU-level reporting also prevents managers from relying exclusively on overall revenue, which can sometimes hide declining performance in important product categories.
Territory and Beat-Wise Sales Report
FMCG sales are highly dependent on geographic coverage. A territory or beat-wise report helps managers understand where sales are coming from and where additional attention is required.
Managers can compare:
-
Territory sales
-
Beat-wise sales
-
Target achievement
-
Outlet coverage
-
Orders generated
-
Sales growth
-
Representative performance
-
Product movement
This is particularly useful when territories have different outlet densities, customer types, or market potential.
A territory producing lower sales is not automatically underperforming. Managers should consider its assigned target, outlet base, historical performance, and distribution potential.
Combining territory reporting with field sales management app gives managers a more practical view of market execution.
Primary and Secondary Sales Report
FMCG managers should clearly distinguish between primary and secondary sales.
Primary sales generally refer to sales from the company to distributors or other channel partners.
Secondary sales refer to sales from distributors to retailers or other downstream customers.
Both are important, but they answer different questions.
Primary sales can indicate how much inventory has moved into the distribution network. Secondary sales provide greater insight into downstream market demand.
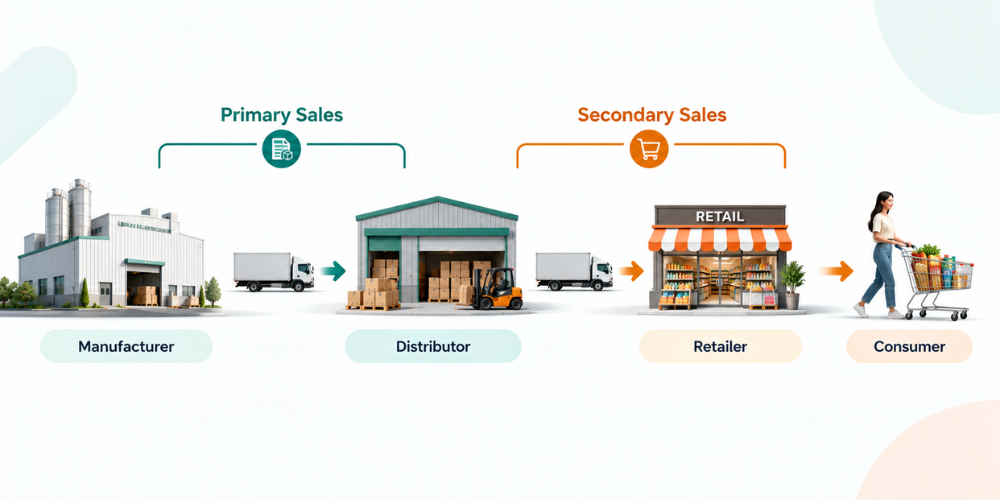
Managers should therefore compare primary and secondary sales instead of relying on primary sales alone.
For example, strong primary sales combined with weak secondary sales may indicate that distributors are accumulating inventory rather than successfully moving products through the market.
Monitoring both levels can help businesses maintain healthier distribution and avoid misleading sales performance conclusions.
Distributor Sales and Order Fulfillment Report
Distributors play a critical role in FMCG distribution. A distributor sales and fulfillment report helps managers understand whether retailer demand is being converted into completed sales.
The report can cover:
-
Distributor-wise sales
-
Orders received
-
Orders fulfilled
-
Pending orders
-
Order processing time
-
Product availability
-
Distributor inventory
-
Retailer demand
This information is particularly useful for distributor management.
Suppose field representatives are consistently booking orders, but several orders remain pending. The issue may not be field sales performance. It could be insufficient distributor stock, delayed order processing, or operational bottlenecks.
Connecting field sales information with distributor data gives managers greater visibility into the complete order cycle.
Stock Availability and Stock-Out Report
Sales teams cannot sell products that are unavailable.
Stock availability should therefore be reviewed alongside sales and order reports. A stock-out report can show which products are unavailable at distributors or other relevant points in the distribution network.
Managers should monitor:
-
Out-of-stock SKUs
-
Low-stock products
-
Distributor inventory
-
High-demand products with low availability
-
Pending replenishment
-
Stock movement
Effective inventory management helps reduce situations where retailers place orders but products cannot be supplied.
Stock reporting is particularly important when sales decline unexpectedly. A drop in SKU sales may indicate lower demand, but it may also simply reflect product unavailability.
By comparing sales trends with inventory information, managers can separate demand problems from supply problems.
Payment Collection and Outstanding Report
Sales growth is important, but revenue is not fully realized until payments are collected.
A daily payment collection report helps managers monitor:
-
Amount collected
-
Collection target
-
Outstanding balance
-
Overdue payments
-
Customer-wise outstanding
-
Distributor-wise outstanding
-
Collection performance by representative
Effective payment collection reporting can help reduce overdue receivables and improve cash flow.
Managers should pay particular attention to customers whose outstanding balances continue increasing despite regular sales.
This report can also be connected with credit limits and payment terms to identify accounts that may require closer monitoring.

Which Sales Numbers Require Immediate Attention?
Not every variation requires immediate managerial intervention. Managers should focus on exceptions that could affect future sales or operational performance.
Important warning signs include:
-
Significant drop in daily sales
-
Repeated target misses
-
Declining productive visit rates
-
High outlet coverage but low order conversion
-
Falling average order value
-
Sudden SKU-level sales decline
-
Territory performance below expectations
-
Rising pending orders
-
Frequent stock-outs
-
Increasing distributor inventory
-
Growing overdue payments
For example, a single day of low sales may not be concerning. But three or four consecutive days of declining sales in the same territory should trigger investigation.
The goal of daily reporting is therefore not to react to every fluctuation. It is to identify meaningful exceptions and recurring patterns.
How Can FMCG Managers Turn Daily Reports Into Action?
Daily sales reports are valuable only when they lead to better decisions. FMCG managers should not simply review numbers and move on. They need to identify performance gaps, understand their causes, assign corrective actions, and monitor whether those actions improve results.
A practical approach is to turn daily reporting into a continuous measure → diagnose → act → monitor process.
1. Identify the Biggest Performance Gaps
Start by comparing actual results with daily or month-to-date targets. Look for significant gaps in sales, outlet coverage, order conversion, SKU movement, or collections.
For example, if a territory achieves only 75% of its expected sales, the manager should investigate whether the issue is related to fewer visits, lower order values, poor product availability, or distributor delays.
2. Find the Reason Behind the Numbers
A sales report shows what happened, but managers need supporting reports to understand why it happened.
If sales are falling, compare sales data with:
-
Field visit activity
-
Productive outlet visits
-
Orders booked
-
Average order value
-
SKU availability
-
Distributor fulfillment
-
Territory performance
For instance, low sales combined with low outlet coverage suggests a field execution issue. Low sales despite strong coverage may indicate weak order conversion, product availability problems, or changing retailer demand.
3. Assign Specific Corrective Actions
Once the cause is identified, managers should assign a clear action instead of simply asking the team to “improve sales.”
Possible actions include:
-
Reworking a sales representative's beat plan
-
Increasing coverage in high-potential outlets
-
Coaching representatives with low productivity
-
Following up on unproductive visits
-
Replenishing fast-moving SKUs
-
Resolving pending distributor orders
-
Following up on overdue payments
-
Focusing sales efforts on declining territories
This turns sales reporting from a monitoring activity into an operational tool.
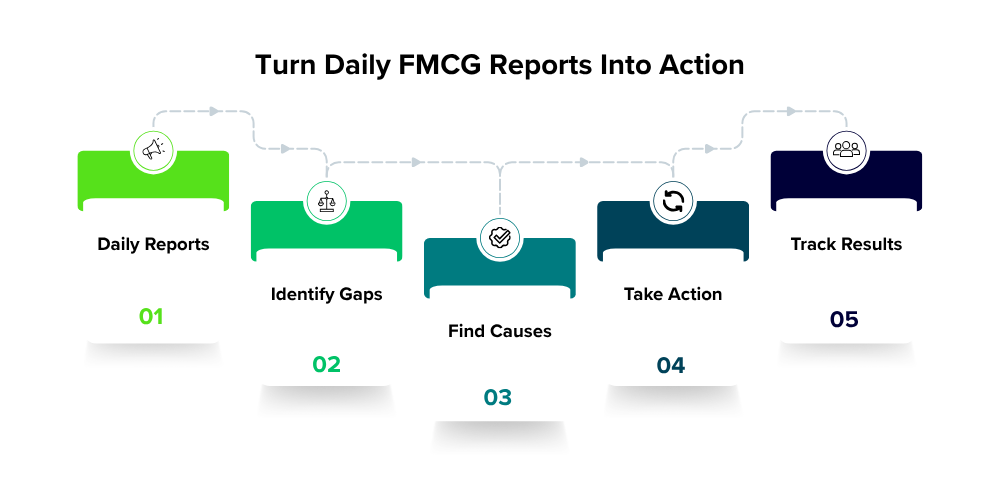
4. Prioritize High-Impact Problems
Not every variation requires immediate intervention. Managers should prioritize problems based on their potential impact on revenue and distribution.
For example, a small sales decline from one low-volume outlet may not require attention. However, repeated sales declines across an entire territory, frequent stock-outs of a high-demand SKU, or a large number of pending retailer orders should receive immediate attention.
5. Monitor the Results the Next Day
Corrective action should be followed by measurement. Managers can compare the next day's results with previous performance to determine whether the intervention worked.
For example:
Low outlet coverage → Route adjustment → More productive visits → Higher order generation
This creates a continuous improvement cycle where daily reports help managers measure the effect of their decisions rather than simply recording historical performance.
6. Use a Centralized Sales Dashboard
When sales, field activity, orders, inventory, distributor performance, and collections are maintained across separate spreadsheets, identifying relationships between metrics can take considerable time.
A centralized sales performance dashboard can give managers a consolidated view of important sales KPIs and help them move from data collection to decision-making faster.
For FMCG teams, the ultimate goal is not to generate more reports. It is to use daily sales data to identify problems early, take targeted action, and improve field and distribution performance consistently.
Final Thoughts
FMCG managers do not need to review dozens of reports every morning. They need the right sales reports to understand performance, identify gaps, and take timely action.
Reports covering sales achievement, sales rep performance, outlet coverage, orders, SKU movement, territory performance, distributor fulfillment, stock availability, and payment collections provide a clear view of daily sales operations.
When this data is connected, managers can quickly identify missed visits, declining sales, stock issues, order gaps, and underperforming territories before they affect monthly targets.
Ready to Simplify Daily Sales Reporting?
Delta Sales App helps FMCG businesses manage field sales, outlet visits, orders, distributor operations, sales tracking, and automated reporting in one platform.
Book a demo today to see how Delta Sales App can help your team turn daily sales data into faster, smarter decisions.