The Hidden Problem Behind FMCG Reports: Why Most Sales Dashboards Fail
In the fast-moving world of FMCG (Fast-Moving Consumer Goods), data is abundant. Companies track distributor orders, outlet coverage, SKU movement, sales rep performance, and inventory levels across multiple geographies. On paper, dashboards look impressive, colorful charts, rising sales graphs, and healthy coverage metrics. Yet, despite all this data, many FMCG brands struggle to translate insights into action, fail to increase revenue effectively, and miss growth opportunities.
This paradox highlights a critical problem: most FMCG dashboards and sales reports are designed for reporting, not for decision-making. They show numbers but fail to connect them with real-world execution. This is what I call the FMCG dashboard illusion, the false sense of control when visibility is mistaken for operational insight.
In this article, we will explore the reasons most dashboards fail, common mistakes brands make, and how to build execution-driven dashboards that actually help FMCG companies scale.
The Hidden Problem Behind FMCG Reports
FMCG brands often assume that simply having a dashboard is enough to control business operations. Companies invest in premium analytics software, build KPI reports, and schedule weekly management reviews. They monitor sales trends, track distributor orders, and check coverage percentages, expecting these numbers to guide decisions.
The hidden problem? Most dashboards highlight numbers without context, focusing on outcomes rather than actions. They show whether sales increased or decreased but rarely explain why problems are occurring on the ground. This creates a situation where management is “looking at data” but not seeing reality.
Here are the key issues broken down into points:
-
Focus on Outcomes, Not Actions
Dashboards often report “what happened”, sales numbers, order volumes, or outlet counts, but rarely indicate the underlying causes. For example, a drop in sales may be flagged, but the dashboard won’t reveal whether it’s due to stock-outs, missed retailer visits, or poor distributor performance. -
Lack of Context for Metrics
Numbers alone are meaningless without context. A high number of orders from distributors may seem positive, but if SKU availability at retail outlets is low, the apparent growth is misleading. Without connecting metrics to field execution, dashboards give a false sense of control. -
Delayed Visibility of Problems
Traditional dashboards often rely on weekly or monthly updates. By the time issues like stock gaps or underperforming territories are visible, lost sales and missed opportunities have already occurred. -
Disconnect Between Strategy and Execution
Sales targets, coverage percentages, and order volumes may look on track, but dashboards rarely capture whether sales reps are following proper beats, retailers are satisfied, or promotional activities are effective. This disconnect prevents leaders from making proactive decisions.
The Traditional FMCG Reporting Model
Historically, FMCG reporting relied on manual, lagging indicators that often failed to provide timely insights. While useful for records, these methods rarely supported proactive decision-making.
-
Monthly Sales Reports from Distributors – Consolidated sales figures were compiled from multiple distributors and submitted monthly. This delay often meant management reacted to problems weeks after they had occurred.
-
Weekly Coverage Summaries from Sales Reps – Sales reps manually reported visits completed each week, but inconsistencies and inaccuracies were common, resulting in unreliable coverage data for performance evaluation.
-
Manual Outlet Data Consolidation – Managers aggregated sales, stock, and coverage data from spreadsheets and reports. This process was time-consuming, error-prone, and provided very little real-time operational visibility.
While this model provided a basic snapshot, it was reactive. By the time a stock-out or underperforming territory became visible in a monthly report, the business had already lost revenue, and corrective actions were delayed.
With modern FMCG markets growing more complex, multiple SKUs, numerous distributors, urban and rural retail coverage, traditional reporting cannot keep pace. Delays in visibility directly, translate into missed growth opportunities.
Where Most Sales Dashboards Go Wrong
Many FMCG dashboards fail because they prioritize appearance over insight. While visually appealing, they often overlook operational realities, leaving leaders unable to act on critical market issues.
-
Over-emphasis on Top-Line Revenue and Order Volume – Dashboards focus on overall sales growth and order totals, masking critical issues like outlet-level underperformance or distributor inefficiencies, limiting actionable insights.
-
Limited Real-Time Field Visibility – Data is often updated weekly or manually collected, preventing managers from monitoring execution in real time, resulting in delayed corrective action on market issues.
-
Fragmented Data Sources – Distributor, retailer, and sales team data are frequently siloed, making comprehensive performance analysis difficult, and leaving leaders without a unified view of market dynamics.
-
No Correlation Between Sales Data and Execution Quality – High sales numbers can hide poor beat execution, inconsistent retailer engagement, or underperforming sales reps, giving a false impression of performance.
-
Dashboards Lack Actionable Ground-Level Insights – Without connecting metrics to field operations, dashboards fail to reveal coverage gaps, stock-outs, or sales rep inefficiencies, preventing timely intervention.
Dashboards that do not provide actionable insights at the ground level leave leaders unaware of real challenges until it’s too late.
The Real Reason Reports Don’t Drive Sales
Most FMCG sales reports fail because they focus on outcomes rather than actions. They show what happened but rarely guide leaders on why or how to fix issues.
-
Why Certain Outlets Are Not Ordering Consistently – Dashboards highlight order numbers but fail to reveal reasons behind inconsistent ordering, such as low stock, weak retailer engagement, or competing promotions.
-
Which Territories Are Underperforming and Why – Sales reports indicate revenue shortfalls but rarely provide insights into specific regions, sales rep effectiveness, or market-level execution issues causing underperformance.
-
Where Stock-Outs or Overstocks Are Occurring – Reports may show total sales but don’t track SKU-level inventory gaps or surplus, preventing timely corrective actions at outlets or distributors.
-
Which Sales Reps Are Driving or Hindering Productivity – High-level numbers mask individual performance variations; reports rarely highlight reps failing beats, missing visits, or inefficiently managing outlets and orders.
Without linking data to execution, dashboards remain historical documentation. Leadership cannot intervene proactively, missing opportunities to improve sales, optimize territories, and strengthen field execution.
Common FMCG Dashboard Mistakes Brands Make
Many FMCG brands unknowingly undermine the effectiveness of their dashboards by repeating the same errors. These mistakes reduce actionable insights, limit field visibility, and hinder real growth.
-
Tracking Vanity Metrics – Metrics like total outlets, gross billing, or total orders may look impressive on dashboards but fail to capture actual retail performance or market expansion.
-
Ignoring Field-Level Insights – Dashboards often overlook beat compliance, retail execution, and outlet coverage, creating blind spots that prevent leadership from understanding on-ground execution issues.
-
Over-Reliance on Lagging Indicators – Monthly revenue and past order reports are reactive, showing problems only after they occur, leaving managers unable to prevent lost sales or coverage gaps.
-
Data Silos – Distributor systems, sales rep apps, and inventory tools operate independently, making it difficult to consolidate data and gain a complete view of market and execution performance.
-
Static Dashboards – Reports rarely update in real time. By the time data reaches management, insights are outdated, making it impossible to act quickly on stock-outs, low coverage, or performance gaps.
These mistakes turn dashboards into beautiful but useless reporting tools, rather than engines for improving execution.
What Sales Leaders Actually Need from Dashboards
Sales leaders need dashboards that go beyond historical numbers. Effective dashboards provide real-time execution visibility, enabling proactive decisions, corrective action, and measurable improvement in revenue and operational performance.
-
Which Outlets Are Actively Generating Revenue – Dashboards should track outlet-level performance, identifying top contributors and underperformers, allowing leaders to focus efforts where revenue impact is highest.
-
Are Sales Reps Achieving Coverage and Productivity Targets – Metrics must reflect visit completion, beat adherence, and quality of interactions, helping managers identify reps who need support or coaching.
-
Are Distributors Fulfilling Orders Consistently – Dashboards should highlight distributor reliability, fulfillment delays, and order discrepancies, enabling timely interventions and smoother supply chain operations.
-
Are SKUs Moving According to Demand Patterns – Tracking SKU-level movement reveals high-demand products, slow movers, and gaps, helping optimize inventory allocation and prevent stock-outs or excess stock.
-
Which Territories Require Immediate Intervention – Dashboards should flag underperforming regions, missed visits, or low sales activity, enabling leaders to deploy resources efficiently and maintain consistent market coverage.
By providing actionable insights, execution-focused dashboards help managers correct course proactively, improving both field execution and overall revenue performance.
The Shift from Data Visibility to Execution Visibility
Leading FMCG brands are realizing that simply displaying numbers on dashboards is no longer enough. Modern dashboards must go beyond data visibility and provide execution visibility, enabling real-time, actionable decisions that drive business growth.
-
Operational Control – Real-time tracking of sales rep activities, outlet coverage, SKU movement, and promotional compliance ensures that field execution aligns with strategic objectives, giving leadership full operational oversight.
![]()
-
Proactive Insights – Instead of waiting for sales drops or stock-outs to appear in reports, execution-focused dashboards identify potential problems early, allowing managers to intervene before issues impact revenue.
-
Decision-Driven Metrics – KPIs are no longer vanity metrics. They focus on actionable outcomes such as revenue improvement, execution quality, repeat orders, territory performance, and distributor effectiveness.
By shifting from passive reporting to execution intelligence, dashboards evolve from simple information displays into strategic decision engines, where every metric provides insight that drives measurable action and business growth.
Building a Dashboard That Drives Real Sales Growth
A truly effective FMCG dashboard goes beyond displaying numbers. It must provide actionable insights that link field execution to revenue, helping brands scale efficiently and maintain competitive advantage.

-
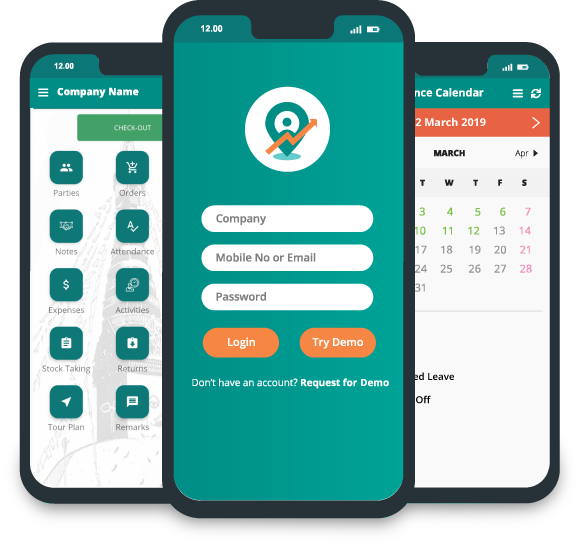
Collect Real-Time Data – Mobile-enabled sales apps and integrated distributor systems provide instant updates on orders, outlet visits, stock levels, and SKU movement, enabling leaders to act immediately.
-
Focus on Actionable KPIs – Metrics such as active outlet ratio, SKU velocity, repeat orders, and retail execution quality reveal true market performance, driving decisions that improve revenue.
-
Provide Alerts and Notifications – Dashboards should automatically flag stock-outs, missed visits, low coverage, or declining territory performance, ensuring issues are addressed proactively before they escalate.
-
Integrate Multiple Data Sources – By combining secondary sales, retail execution, and field activity data, dashboards provide a unified view, eliminating silos and enabling holistic operational insights.
-
Enable Proactive Decision-Making – Advanced dashboards predict trends, highlight underperforming territories, and guide interventions, helping sales leaders optimize resources, improve coverage, and maximize growth opportunities.
This execution-focused approach transforms raw data into actionable insights, empowering FMCG brands to make faster decisions, optimize field operations, and achieve sustainable sales growth.
Final Thoughts
Most FMCG dashboards fail because they prioritize reporting past results instead of enabling real-time decisions. The real value of a dashboard lies not in how many charts it shows, but in how effectively it guides action.
By shifting from vanity metrics to execution-focused KPIs, integrating real-time data, and connecting strategy with field reality, FMCG brands can transform dashboards into decision engines that improve revenue, execution, and growth.
Upgrade your FMCG dashboard today to gain instant visibility, actionable intelligence, and measurable sales growth and turn data into real results now.